CrashCount NYC
See the crashes on your streets. Build the case for safer ones.
CrashCount helps neighbors advocate for safer streets using police crash records, political records, local reporting, and open geographic data.
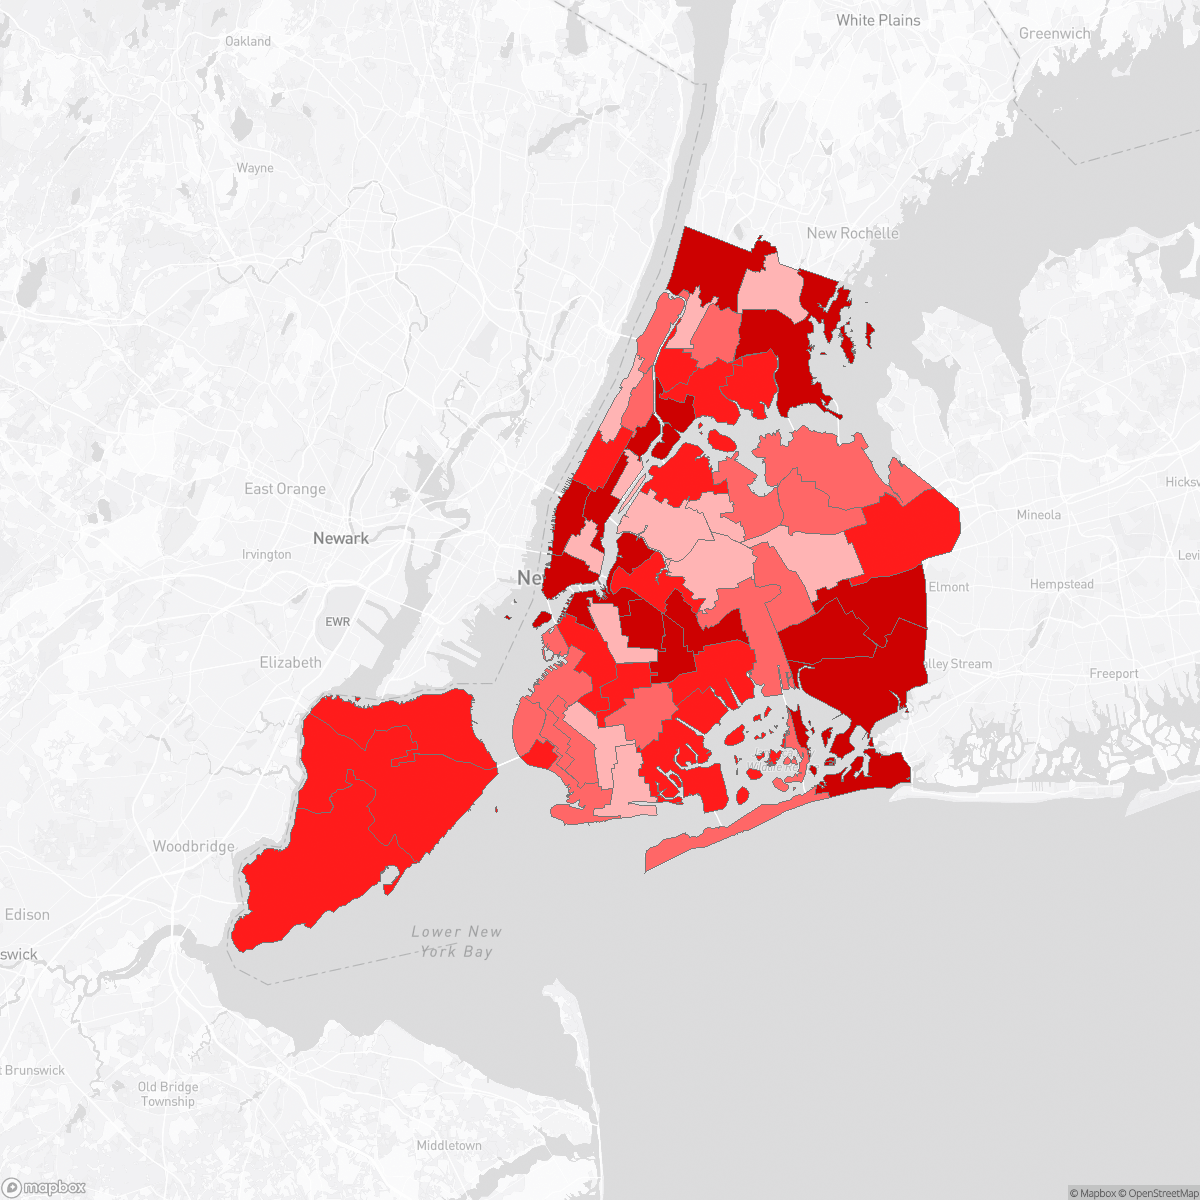
We provide individual dashboards for 525 regions, including all boroughs, city council districts, state assembly districts, state senate districts, police precincts, community boards, and neighborhoods.
Crash Finder
Try Crash Finder
Look up any street, school, address, or intersection to see how safe the streets are.
Built from public evidence - updated nightly
CrashCount uses vetted public datasets and reporting feeds, refreshed nightly.
NYC Crash Count
Jan 1, 2026 - Jun 11, 2026- Crashes 36,424
- Injuries 20,661
- Serious injuries 1,202
- Deaths 96
Driver Fatally Hits Woman in Queens Bike Lane, Police Say


Recent coverage and public statements
Press coverage
Car Rolls Over in Bed-Stuy
A car lay on its side near Kosciuszko Street before dawn. Video caught the wreck. Officials have not said why it happened or whether anyone was hurt.
Press coverage
BX6 bus slams into stopped BX5
Two MTA buses met hard on Hunts Point Avenue. A BX6 hit the rear of a parked BX5 with riders aboard. Five passengers were hurt. Seats buckled. One rider’s leg was trapped.
Press coverage
Riverdale seeks changes on West 259th
On West 259th, drivers speed downhill and roll stop signs. A taxi T-boned a neighbor at a left turn. Residents want humps, signs, or a light. DOT says it will review.
Press coverage
E-scooter hits marked NYPD car
Two 14-year-olds on one e-scooter collided with a marked NYPD vehicle at 101st Street and Northern Boulevard. Both teens and two officers went to hospitals. The boys were taken into custody.
Turn local evidence into action
When people can see what is happening nearby, they become a force for safer streets. Use this data to push for lower speeds and stronger repeat-offender enforcement.