New York City
Crash Narratives
Queensboro Bridge death as NYC sees 4 killed in 7 days
May 21 to May 28 saw 68 crashes in New York City. Four people died. Seventy eight had serious injuries. This citywide alert has fired 12 times in 90 days.
May 21 to May 28 brought 68 crashes citywide. Four people died. Seventy eight people had serious injuries.
On the Queensboro Bridge bike path police say a rider blew traffic control. Police say he hit a cyclist and killed him. This citywide danger window keeps returning. This alert has fired 12 times in 90 days and 12 times in 365 days. Citywide leaders must answer for the pace. A real plan must slow streets and protect crossings and bike paths.
- 68 crashes in last 7 days
- 78 serious injuries
- 4 deaths
- On the Queensboro Bridge bike path, a 39-year-old rider disregarded traffic control and changed lanes unsafely. Police say he hit a 35-year-old cyclist, killing him.
- Police say a driver backed unsafely on Parrott Place and hit a 37-year-old man working in the roadway. The pedestrian died.
- A driver disregarded traffic control at Francis Lewis Boulevard and Union Turnpike and hit two pedestrians crossing with the signal. A 71-year-old woman suffered head crush injuries and was left unconscious.
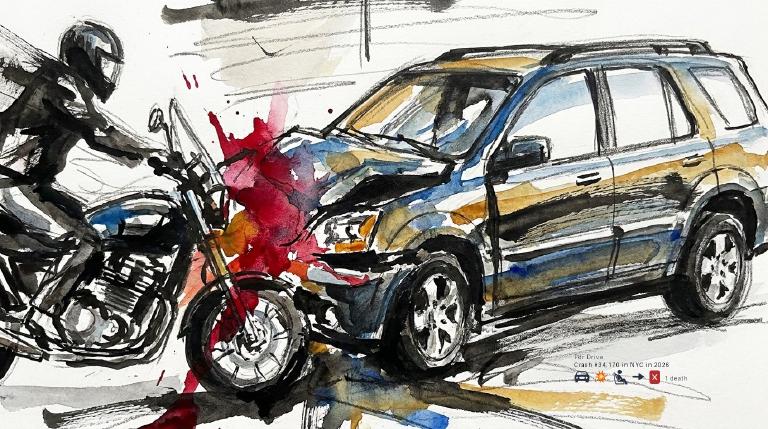
Driver hit motorcyclist on FDR Drive
A driver hit a 48-year-old motorcyclist on FDR Drive just before midnight. The rider was ejected and killed.
New York City: Traffic Crash Statistics
Crash Counter for New York City 34,170 crashes • 90 deaths
About these crash totals
Counts come from NYC police crash reports (NYPD Motor Vehicle Collisions on NYC Open Data). We sum all crashes, injuries, and deaths for this area across the selected time window shown on the card. Injury severity follows DOT's KABCO definitions mapped from the NYPD Person table (injury status, injury type, and injury location).
- Crashes: number of police‑reported collisions (all road users).
- All injuries: people with any reported injury (KABCO A/B/C or generic "injured").
- Moderate / Serious: suspected minor + suspected serious injuries (KABCO B + A).
- Deaths: killed or apparent death reported by police (KABCO K).
Change badges (arrows and percentages) compare the selected window with the same period last year whenever we have enough history. The “From 2022” view shows totals across the full span since 2022. When a comparison window isn’t available the badge shows an em dash.
Notes: Police reports can be corrected after initial publication. We cannot verify "death within 30 days" or hospital outcomes, so small differences from DOT totals are possible. Minor incidents without a police report are not included.
CloseCaught Speeding in NYC KXM7078 — 231 times
- 231 speed-camera tickets citywide in 12 monthsNY KXM7078 · 2022 Gray Ford Pickup
- 231 speed-camera tickets citywide in 12 monthsNY KWC3138 · 2022 Gray Mitsubishi Suburban
- 190 speed-camera tickets citywide in 12 monthsNC 7M6148 · 2020 Black Harle Motorcycle
- 176 speed-camera tickets citywide in 12 monthsNY KZF9054 · 2023 Black Mitsubishi Suburban
- 169 speed-camera tickets citywide in 12 monthsNY LHW5598 · 2023 Black Toyota Sedan
About this list
This ranks vehicles caught speeding in this area during the latest 12-month window by the number of NYC school-zone speed-camera violations they received anywhere in the city during that same window.
Camera violations are issued by NYC DOT’s program. Counts reflect issued tickets and may omit dismissed or pending cases. Plate text is shown verbatim as recorded.
CloseDangerous Schools in NYC Loading school hotspots...
| School | Crashes
Injuries
Child injuries
Deaths |
|---|
Dangerous Streets in NYC Loading street hotspots...
| Street | Crashes
Injuries
Child injuries
Deaths |
|---|
Dangerous Intersections in NYC Loading intersection hotspots...
| Intersection | Crashes
Injuries
Child injuries
Deaths |
|---|
Crash Finder
Try Crash Finder
Look up any street, school, address, or intersection to see how safe the streets are.
NYC Hot Spots Danger zones and recent crashes
Traffic Safety Timeline Tap to view recent events
Carnage in NYC 371 Whiplash (Neck)
▸ Killed 90
▸ Crush Injuries 129
▸ Amputation 5
▸ Severe Bleeding 67
▸ Severe Lacerations 57
▸ Concussion 148
▸ Fracture/Dislocation 266
▸ Internal Injury 284
▸ Whiplash 1,048
▸ Contusion/Bruise 1,191
▸ Abrasion 552
▸ Pain/Nausea 490
Crashes by Hour in NYC 5 PM • 1,227 injuries ↑8.1%
Who is getting hurt? Kids 1,554 injuries ↓3.3% Seniors 1,527 injuries ↓3.8%
Toggle on at least one mode to see people totals.
Totals count people injured or killed. Use the mode filters above to focus the stacks.
Dangerous Bike Lanes in NYC Loading bike lane hotspots...
| Bike lane | Crashes
Cyclist injuries
Child injuries
Cyclist deaths |
|---|
What Crashes Cost Here Loading estimate...
Loading crash cost estimate...
The three blocks below show direct costs, other harm, and the total for crashes with injuries, crashes without injuries, and all crashes together.
How we calculate this
We calculate these costs using a method developed by the National Highway Traffic Safety Administration, or NHTSA. It gives one set of costs for crashes with injuries and another for crashes with no reported injuries.
Crashes with injuries cost much more because the method includes things like lost work, medical care, and long-term harm. NHTSA says crash costs include "lost productivity, medical, legal and court costs, emergency service, insurance administration, congestion, property damage, and workplace losses."
These are estimates, not bills. "Other harm" is the part of the broader estimate that goes beyond direct bills and insurance claims. It captures pain, disability, and lost quality of life.
Download the math (CSV) · Download the math (JSON) · Method and sources
Preventable Speeding 113,001 16+ offenders ↓70%
Repeat School-Zone Speeding Offenders
- ≥ 6: 266,669 (2026 year-to-date) • Prev: 852,986 2025 year-to-date
- ≥ 16: 113,001 (2026 year-to-date) • Prev: 370,754 2025 year-to-date
Pedestrian Injuries 96% by Cars and Trucks ↓4.8%
About this chart
We group pedestrian injuries and deaths by the vehicle type that struck them (as recorded in police reports). Use the year selector to compare the current window with the prior period.
- Trucks/Buses, SUVs/Cars, Mopeds, and Bikes reflect the broad categories we use to track vehicle harm.
- Counts include people on foot only; crashes with no injured pedestrians do not appear in this card.
Notes: Police classification can change during investigations. Small categories may have year-to-year variance.
CloseMayor Zohran Mamdani —
Mayor Zohran Mamdani
New York City
Other Geographies See nearby areas
▸ Other Geographies
