Queens
Crash Narratives
Queens had 254 crashes in 7 days. Two people died.
From May 25 to June 1 Queens saw 254 crashes. Two people died. Eighteen had serious injuries.
Queens had 254 crashes from May 25 to June 1. Two people died. Eighteen people had serious injuries and 86 had moderate injuries.
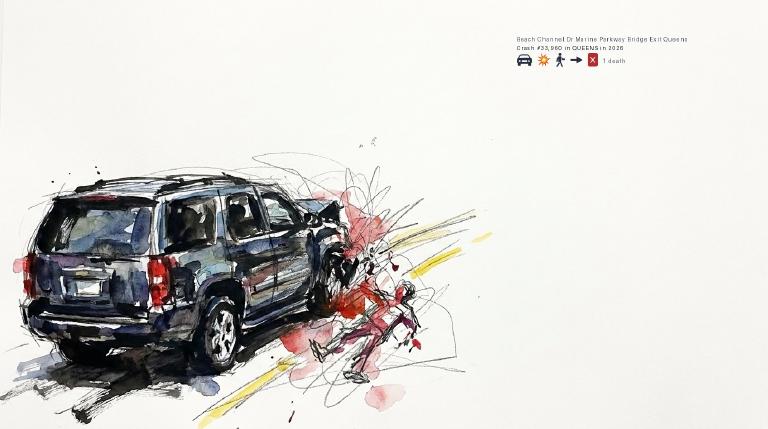
On June 1 a driver in a Kia Telluride killed an 18 year old on Beach Channel Drive. Police wrote pedestrian error or confusion. This borough has triggered this alert 15 times in 90 days. It has triggered 15 times in 365 days. Queens leaders can move now with slower streets and harder enforcement on repeat speeders.
- 254 crashes in last 7 days
- 18 serious injuries
- 2 deaths
- A driver in a Kia Telluride hit and killed an 18-year-old woman on Beach Channel Drive near the Marine Parkway Bridge exit. Police recorded pedestrian error/confusion.
- A driver disregarded traffic control at Francis Lewis Boulevard and Union Turnpike and hit two pedestrians crossing with the signal. A 71-year-old woman suffered head crush injuries and was left unconscious.
- A driver hit a 28-year-old cyclist near 188th Street and 89th Avenue. Police recorded driver inattention/distraction, and the cyclist suffered a head injury.
SUV driver hit, killed 18-year-old
A driver in a Kia Telluride hit and killed an 18-year-old woman on Beach Channel Drive near the Marine Parkway Bridge exit. Police recorded pedestrian error/confusion.
Queens: Traffic Crash Statistics
Crash Counter for Queens 9,438 crashes • 26 deaths
About these crash totals
Counts come from NYC police crash reports (NYPD Motor Vehicle Collisions on NYC Open Data). We sum all crashes, injuries, and deaths for this area across the selected time window shown on the card. Injury severity follows DOT's KABCO definitions mapped from the NYPD Person table (injury status, injury type, and injury location).
- Crashes: number of police‑reported collisions (all road users).
- All injuries: people with any reported injury (KABCO A/B/C or generic "injured").
- Moderate / Serious: suspected minor + suspected serious injuries (KABCO B + A).
- Deaths: killed or apparent death reported by police (KABCO K).
Change badges (arrows and percentages) compare the selected window with the same period last year whenever we have enough history. The “From 2022” view shows totals across the full span since 2022. When a comparison window isn’t available the badge shows an em dash.
Notes: Police reports can be corrected after initial publication. We cannot verify "death within 30 days" or hospital outcomes, so small differences from DOT totals are possible. Minor incidents without a police report are not included.
CloseCaught Speeding in Queens KXM7078 — 231 times
- 231 speed-camera tickets citywide in 12 monthsNY KXM7078 · 2022 Gray Ford Pickup
- 190 speed-camera tickets citywide in 12 monthsNC 7M6148 · 2020 Black Harle Motorcycle
- 163 speed-camera tickets citywide in 12 monthsNY KXM8750 · 2023 Black Mitsubishi Suburban
- 156 speed-camera tickets citywide in 12 monthsGA SGY7043 · 2021 White Me/Be 4S
- 114 speed-camera tickets citywide in 12 monthsNY MBK3184 · 2022 Black BMW Suburban
About this list
This ranks vehicles caught speeding in this area during the latest 12-month window by the number of NYC school-zone speed-camera violations they received anywhere in the city during that same window.
Camera violations are issued by NYC DOT’s program. Counts reflect issued tickets and may omit dismissed or pending cases. Plate text is shown verbatim as recorded.
CloseDangerous Schools in Queens Loading school hotspots...
| School | Crashes
Injuries
Child injuries
Deaths |
|---|
Dangerous Streets in Queens Loading street hotspots...
| Street | Crashes
Injuries
Child injuries
Deaths |
|---|
Dangerous Intersections in Queens Loading intersection hotspots...
| Intersection | Crashes
Injuries
Child injuries
Deaths |
|---|
Crash Finder
Try Crash Finder
Look up any street, school, address, or intersection to see how safe the streets are.
Queens Hot Spots Danger zones and recent crashes
Traffic Safety Timeline Tap to view recent events
Carnage in Queens 111 Whiplash (Neck)
▸ Killed 26
▸ Crush Injuries 53
▸ Severe Bleeding 10
▸ Severe Lacerations 11
▸ Concussion 25
▸ Fracture/Dislocation 52
▸ Internal Injury 100
▸ Whiplash 267
▸ Contusion/Bruise 296
▸ Abrasion 113
▸ Pain/Nausea 101
Crashes by Hour in Queens 3 PM • 335 injuries →0%
Who is getting hurt? Kids 467 injuries ↓0.2% Seniors 451 injuries ↓2.8%
Toggle on at least one mode to see people totals.
Totals count people injured or killed. Use the mode filters above to focus the stacks.
Dangerous Bike Lanes in Queens Loading bike lane hotspots...
| Bike lane | Crashes
Cyclist injuries
Child injuries
Cyclist deaths |
|---|
What Crashes Cost Here Loading estimate...
Loading crash cost estimate...
The three blocks below show direct costs, other harm, and the total for crashes with injuries, crashes without injuries, and all crashes together.
How we calculate this
We calculate these costs using a method developed by the National Highway Traffic Safety Administration, or NHTSA. It gives one set of costs for crashes with injuries and another for crashes with no reported injuries.
Crashes with injuries cost much more because the method includes things like lost work, medical care, and long-term harm. NHTSA says crash costs include "lost productivity, medical, legal and court costs, emergency service, insurance administration, congestion, property damage, and workplace losses."
These are estimates, not bills. "Other harm" is the part of the broader estimate that goes beyond direct bills and insurance claims. It captures pain, disability, and lost quality of life.
Download the math (CSV) · Download the math (JSON) · Method and sources
Preventable Speeding 41,554 16+ offenders ↓70%
Repeat School-Zone Speeding Offenders
- ≥ 6: 100,102 (2026 year-to-date) • Prev: 318,831 2025 year-to-date
- ≥ 16: 41,554 (2026 year-to-date) • Prev: 137,116 2025 year-to-date
Pedestrian Injuries 97% by Cars and Trucks ↓3.2%
About this chart
We group pedestrian injuries and deaths by the vehicle type that struck them (as recorded in police reports). Use the year selector to compare the current window with the prior period.
- Trucks/Buses, SUVs/Cars, Mopeds, and Bikes reflect the broad categories we use to track vehicle harm.
- Counts include people on foot only; crashes with no injured pedestrians do not appear in this card.
Notes: Police classification can change during investigations. Small categories may have year-to-year variance.
CloseOther Geographies See nearby areas
▸ Other Geographies
Queens Queens sits in District 19, AD 23, SD 10.
It contains Queens CB 1, Queens CB 2, Queens CB 3, Queens CB 4, Queens CB 5, Queens CB 6, Queens CB 7, Queens CB 8, Queens CB 9, Queens CB 10, Queens CB 11, Queens CB 12, Queens CB 13, Queens CB 14, Queens CB 80, Queens CB 81, Queens CB 82, Queens CB 83, Queens CB 84, District 19, District 20, District 21, District 22, District 23, District 24, District 25, District 26, District 27, District 28, District 29, District 30, District 31, District 32, Astoria (North)-Ditmars-Steinway, Old Astoria-Hallets Point, Astoria (Central), Astoria (East)-Woodside (North), Queensbridge-Ravenswood-Dutch Kills, Sunnyside Yards (North), St. Michael's Cemetery, Astoria Park, Long Island City-Hunters Point, Sunnyside, Woodside, Sunnyside Yards (South), Calvary & Mount Zion Cemeteries, Jackson Heights, East Elmhurst, North Corona, Elmhurst, Corona, Maspeth, Ridgewood, Glendale, Middle Village, Mount Olivet & All Faiths Cemeteries, Middle Village Cemetery, St. John Cemetery, Highland Park-Cypress Hills Cemeteries (North), Rego Park, Forest Hills, College Point, Whitestone-Beechhurst, Bay Terrace-Clearview, Murray Hill-Broadway Flushing, East Flushing, Queensboro Hill, Flushing-Willets Point, Fort Totten, Kissena Park, Kew Gardens Hills, Pomonok-Electchester-Hillcrest, Fresh Meadows-Utopia, Jamaica Estates-Holliswood, Jamaica Hills-Briarwood, Mount Hebron & Cedar Grove Cemeteries, Cunningham Park, Kew Gardens, Richmond Hill, South Richmond Hill, Ozone Park (North), Woodhaven, South Ozone Park, Ozone Park, Howard Beach-Lindenwood, Spring Creek Park, Auburndale, Bayside, Douglaston-Little Neck, Oakland Gardens-Hollis Hills, Alley Pond Park, Jamaica, South Jamaica, Baisley Park, Springfield Gardens (North)-Rochdale Village, St. Albans, Hollis, Glen Oaks-Floral Park-New Hyde Park, Bellerose, Queens Village, Cambria Heights, Laurelton, Springfield Gardens (South)-Brookville, Rosedale, Montefiore Cemetery, Far Rockaway-Bayswater, Rockaway Beach-Arverne-Edgemere, Breezy Point-Belle Harbor-Rockaway Park-Broad Channel, Rockaway Community Park, LaGuardia Airport, Flushing Meadows-Corona Park, Forest Park, John F. Kennedy International Airport, Jamaica Bay (East), Jacob Riis Park-Fort Tilden-Breezy Point Tip, Precinct 100, Precinct 101, Precinct 102, Precinct 103, Precinct 104, Precinct 105, Precinct 106, Precinct 107, Precinct 108, Precinct 109, Precinct 110, Precinct 111, Precinct 112, Precinct 113, Precinct 114, Precinct 115, Precinct 116.
▸ See also
