Manhattan
Crash Narratives
Manhattan week of wrecks leaves 1 dead and 10 seriously hurt
May 31 to June 7 saw 10 crashes in Manhattan. One person died and 10 suffered serious injuries.
May 31 to June 7 saw 10 crashes in Manhattan. One person died and 10 suffered serious injuries. A 48 year old motorcyclist was killed on FDR Drive near midnight.
This borough has triggered 11 times in 90 days. It has triggered 11 times in 365 days. Manhattan Borough President Brad Hoylman-Sigal should answer for safe street wins. The demand is quick redesigns and hard enforcement on the worst corridors.
- 10 crashes in last 7 days
- 10 serious injuries
- 1 death
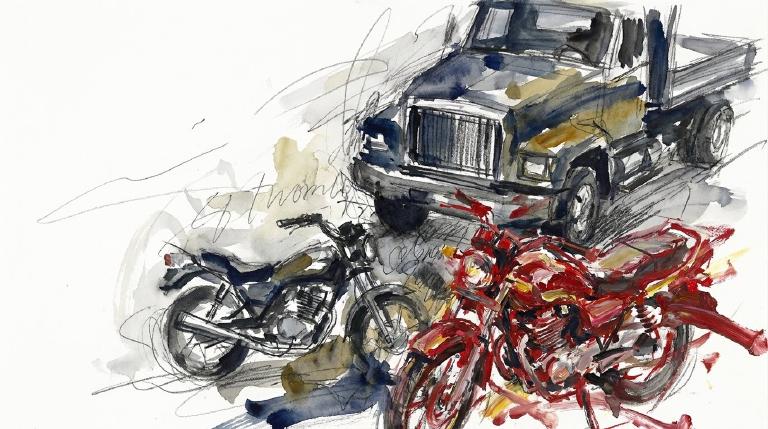
- A driver hit a 48-year-old motorcyclist on FDR Drive just before midnight. The rider was ejected and killed.
- At 11:45 p.m. on Delancey Street at Suffolk Street, a driver going straight hit a 60-year-old pedestrian. She suffered an abdomen/pelvis fracture and dislocation.
- A bike rider disregarded traffic control on Amsterdam Avenue and hit a 78-year-old woman crossing with the signal. She suffered a shoulder/upper-arm fracture and dislocation.
Manhattan: Traffic Crash Statistics
Crash Counter for Manhattan 6,130 crashes • 16 deaths
About these crash totals
Counts come from NYC police crash reports (NYPD Motor Vehicle Collisions on NYC Open Data). We sum all crashes, injuries, and deaths for this area across the selected time window shown on the card. Injury severity follows DOT's KABCO definitions mapped from the NYPD Person table (injury status, injury type, and injury location).
- Crashes: number of police‑reported collisions (all road users).
- All injuries: people with any reported injury (KABCO A/B/C or generic "injured").
- Moderate / Serious: suspected minor + suspected serious injuries (KABCO B + A).
- Deaths: killed or apparent death reported by police (KABCO K).
Change badges (arrows and percentages) compare the selected window with the same period last year whenever we have enough history. The “From 2022” view shows totals across the full span since 2022. When a comparison window isn’t available the badge shows an em dash.
Notes: Police reports can be corrected after initial publication. We cannot verify "death within 30 days" or hospital outcomes, so small differences from DOT totals are possible. Minor incidents without a police report are not included.
CloseCaught Speeding in Manhattan KXM7078 — 286 times
- 286 speed-camera tickets citywide in 12 monthsNY KXM7078 · 2022 Gray Ford PickupCaught here 8 times in the last 12 months.Typically speeds citywide in: East New York-New Lots (27), Crown Heights (North) (22), and Concourse-Concourse Village (16).
- 240 speed-camera tickets citywide in 12 monthsNY KWC3138 · 2022 Gray Mitsubishi SuburbanCaught here 1 time in the last 12 months.Typically speeds citywide in: Mount Hope (24), Fordham Heights (18), and Bedford Park (17).
- 196 speed-camera tickets citywide in 12 monthsGA RUN1724 · 2020 Black BMW MpCaught here 1 time in the last 12 months.Typically speeds citywide in: Crown Heights (North) (88), Prospect Heights (19), and Spring Creek-Starrett City (12).
- 191 speed-camera tickets citywide in 12 monthsNY KZF9054 · 2023 Black Mitsubishi SuburbanCaught here 4 times in the last 12 months.Typically speeds citywide in: East New York-New Lots (13), Ocean Hill (11), and Crown Heights (North) (10).
- 188 speed-camera tickets citywide in 12 monthsVA SZN9879 · 2016 Gray Mercedes-Benz SedanCaught here 4 times in the last 12 months.Typically speeds citywide in: East Flatbush-Rugby (59), Canarsie (14), and Flatlands (13).
About this list
This ranks vehicles caught speeding in this area during the latest 12-month window by the number of NYC school-zone speed-camera violations they received anywhere in the city during that same window.
Camera violations are issued by NYC DOT’s program. Counts reflect issued tickets and may omit dismissed or pending cases. Plate text is shown verbatim as recorded.
CloseDangerous Schools in Manhattan Loading school hotspots...
| School | Crashes
Injuries
Child injuries
Deaths |
|---|
Dangerous Streets in Manhattan Loading street hotspots...
| Street | Crashes
Injuries
Child injuries
Deaths |
|---|
Dangerous Intersections in Manhattan Loading intersection hotspots...
| Intersection | Crashes
Injuries
Child injuries
Deaths |
|---|
Crash Finder
Try Crash Finder
Look up any street, school, address, or intersection to see how safe the streets are.
Manhattan Hot Spots Danger zones and recent crashes
Traffic Safety Timeline Tap to view recent events
Carnage in Manhattan 86 Contusion/Bruise (Lower leg/foot)
▸ Killed 16
▸ Crush Injuries 14
▸ Amputation 3
▸ Severe Bleeding 11
▸ Severe Lacerations 18
▸ Concussion 33
▸ Fracture/Dislocation 65
▸ Internal Injury 36
▸ Whiplash 178
▸ Contusion/Bruise 260
▸ Abrasion 155
▸ Pain/Nausea 104
Crashes by Hour in Manhattan 3 PM • 205 injuries ↑9.0%
Who is getting hurt? Kids 184 injuries ↑30% Seniors 245 injuries ↓12%
Toggle on at least one mode to see people totals.
Totals count people injured or killed. Use the mode filters above to focus the stacks.
Dangerous Bike Lanes in Manhattan Loading bike lane hotspots...
| Bike lane | Crashes
Cyclist injuries
Child injuries
Cyclist deaths |
|---|
What Crashes Cost Here Loading estimate...
Loading crash cost estimate...
The three blocks below show direct costs, other harm, and the total for crashes with injuries, crashes without injuries, and all crashes together.
How we calculate this
We calculate these costs using a method developed by the National Highway Traffic Safety Administration, or NHTSA. It gives one set of costs for crashes with injuries and another for crashes with no reported injuries.
Crashes with injuries cost much more because the method includes things like lost work, medical care, and long-term harm. NHTSA says crash costs include "lost productivity, medical, legal and court costs, emergency service, insurance administration, congestion, property damage, and workplace losses."
These are estimates, not bills. "Other harm" is the part of the broader estimate that goes beyond direct bills and insurance claims. It captures pain, disability, and lost quality of life.
Download the math (CSV) · Download the math (JSON) · Method and sources
Preventable Speeding 6,694 16+ offenders ↓71%
Repeat School-Zone Speeding Offenders
- ≥ 6: 17,473 (2026 year-to-date) • Prev: 57,876 2025 year-to-date
- ≥ 16: 6,694 (2026 year-to-date) • Prev: 22,710 2025 year-to-date
Pedestrian Injuries 92% by Cars and Trucks ↓4.2%
About this chart
We group pedestrian injuries and deaths by the vehicle type that struck them (as recorded in police reports). Use the year selector to compare the current window with the prior period.
- Trucks/Buses, SUVs/Cars, Mopeds, and Bikes reflect the broad categories we use to track vehicle harm.
- Counts include people on foot only; crashes with no injured pedestrians do not appear in this card.
Notes: Police classification can change during investigations. Small categories may have year-to-year variance.
CloseBorough President Brad Hoylman-Sigal —
Other Geographies See nearby areas
▸ Other Geographies
Manhattan Manhattan sits in District 3, AD 65, SD 27.
It contains Manhattan CB 1, Manhattan CB 2, Manhattan CB 3, Manhattan CB 4, Manhattan CB 5, Manhattan CB 6, Manhattan CB 7, Manhattan CB 8, Manhattan CB 9, Manhattan CB 10, Manhattan CB 11, Manhattan CB 12, Manhattan CB 64, District 1, District 10, District 2, District 3, District 4, District 5, District 6, District 7, District 8, District 9, Kingsbridge-Marble Hill, Financial District-Battery Park City, Tribeca-Civic Center, The Battery-Governors Island-Ellis Island-Liberty Island, SoHo-Little Italy-Hudson Square, Greenwich Village, West Village, Chinatown-Two Bridges, Lower East Side, East Village, Chelsea-Hudson Yards, Hell's Kitchen, Midtown South-Flatiron-Union Square, Midtown-Times Square, Stuyvesant Town-Peter Cooper Village, Gramercy, Murray Hill-Kips Bay, East Midtown-Turtle Bay, United Nations, Upper West Side-Lincoln Square, Upper West Side (Central), Upper West Side-Manhattan Valley, Upper East Side-Lenox Hill-Roosevelt Island, Upper East Side-Carnegie Hill, Upper East Side-Yorkville, Morningside Heights, Manhattanville-West Harlem, Hamilton Heights-Sugar Hill, Harlem (South), Harlem (North), East Harlem (South), East Harlem (North), Randall's Island, Washington Heights (South), Washington Heights (North), Inwood, Highbridge Park, Inwood Hill Park, Central Park, Precinct 1, Precinct 10, Precinct 13, Precinct 14, Precinct 17, Precinct 18, Precinct 19, Precinct 20, Precinct 22, Precinct 23, Precinct 24, Precinct 25, Precinct 26, Precinct 28, Precinct 30, Precinct 32, Precinct 33, Precinct 34, Precinct 5, Precinct 6, Precinct 7, Precinct 9.
▸ See also
