Brooklyn
Crash Narratives
Brooklyn’s violent week: 26 crashes, 3 deaths
From March 6 to March 13, Brooklyn saw 26 crashes with 29 serious injuries and 3 deaths.
Brooklyn is already high danger. This week was worse.
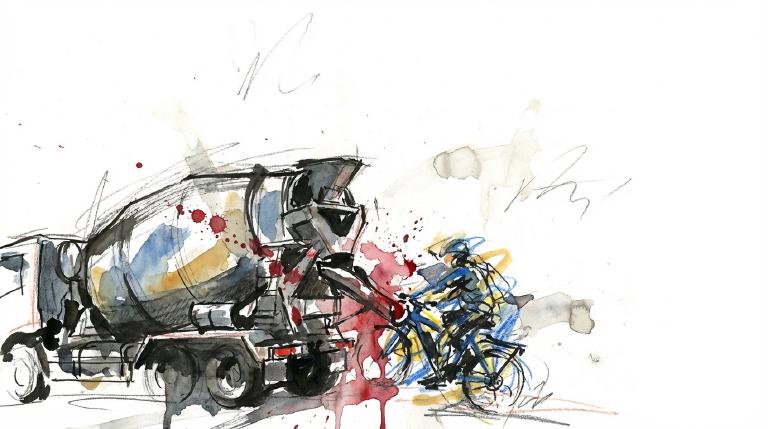
From March 6 to March 13, 26 crashes left 29 people seriously hurt and 3 dead. One man on an e-bike was killed near 16th Avenue and 49th Street after a cement truck driver hit him. A pedestrian died on Linden Boulevard before dawn. A passenger died after a driver blew traffic control on Avenue S.
This borough alert has fired 14 times in the last 90 days. The fix is not a poster. Brooklyn leaders should back street redesigns that slow turns, cut speeding, and protect crossings, plus a citywide 20 MPH law.
- 26 crashes in last 7 days
- 29 serious injuries
- 3 deaths
- A driver in a cement truck hit a 53-year-old e-bike rider near 16th Avenue and 49th Street, killing him. Police recorded driver inattention and improper passing or lane use.
- A driver disregarded traffic control on Avenue S near W 11th Street, police say, setting off a multi-vehicle crash that killed a 78-year-old passenger. Multiple other occupants reported pain and nausea.
- Before dawn on Linden Boulevard, police say a distracted driver hit and killed a man in the roadway. Another SUV driver was also listed in the crash.
Brooklyn: Traffic Crash Statistics
Crash Counter for Brooklyn 5,277 crashes • 13 deaths
About these crash totals
Counts come from NYC police crash reports (NYPD Motor Vehicle Collisions on NYC Open Data). We sum all crashes, injuries, and deaths for this area across the selected time window shown on the card. Injury severity follows DOT's KABCO definitions mapped from the NYPD Person table (injury status, injury type, and injury location).
- Crashes: number of police‑reported collisions (all road users).
- All injuries: people with any reported injury (KABCO A/B/C or generic "injured").
- Moderate / Serious: suspected minor + suspected serious injuries (KABCO B + A).
- Deaths: killed or apparent death reported by police (KABCO K).
Change badges (arrows and percentages) compare the selected window with the same period last year whenever we have enough history. The “From 2022” view shows totals across the full span since 2022. When a comparison window isn’t available the badge shows an em dash.
Notes: Police reports can be corrected after initial publication. We cannot verify "death within 30 days" or hospital outcomes, so small differences from DOT totals are possible. Minor incidents without a police report are not included.
CloseCaught Speeding Recently in Brooklyn KXM7078 — 244 times
- 2022 Gray Ford Pickup (KXM7078) – 244 tickets citywide • 8 in last 90d here
- 2019 Nissan Sedan (KZC2999) – 196 tickets citywide • 10 in last 90d here
- 2013 White Ford Bu (TLN8692) – 184 tickets citywide • 11 in last 90d here
- 2023 Black Kia Suburban (KNM2347) – 183 tickets citywide • 1 in last 90d here
- 2023 White RAM Pickup (LCK7735) – 171 tickets citywide • 1 in last 90d here
About this list
This ranks vehicles by the number of NYC school‑zone speed‑camera violations they received in the last 12 months anywhere in the city. The smaller note shows how many times the same plate was caught in this area in the last 90 days.
Camera violations are issued by NYC DOT’s program. Counts reflect issued tickets and may omit dismissed or pending cases. Plate text is shown verbatim as recorded.
CloseDangerous Schools in Brooklyn Loading school hotspots...
| School | Crashes
Injuries
Child injuries
Deaths |
|---|
Dangerous Streets in Brooklyn Loading street hotspots...
| Street | Crashes
Injuries
Child injuries
Deaths |
|---|
Dangerous Intersections in Brooklyn Loading intersection hotspots...
| Intersection | Crashes
Injuries
Child injuries
Deaths |
|---|
Crash Finder
Try Crash Finder
Look up any street, school, address, or intersection to see how safe the streets are.
Brooklyn Hot Spots Danger zones and recent crashes
Traffic Safety Timeline Tap to view recent events
Carnage in Brooklyn 44 Whiplash (Neck)
▸ Killed 13
▸ Crush Injuries 17
▸ Severe Bleeding 10
▸ Severe Lacerations 8
▸ Concussion 20
▸ Fracture/Dislocation 28
▸ Internal Injury 38
▸ Whiplash 126
▸ Contusion/Bruise 143
▸ Abrasion 57
▸ Pain/Nausea 72
Crashes by Hour in Brooklyn 5 PM • 180 injuries ↑25%
Who is getting hurt? Kids 204 injuries ↓13% Seniors 213 injuries ↓9.7%
Toggle on at least one mode to see people totals.
Totals count people injured or killed. Use the mode filters above to focus the stacks.
Dangerous Bike Lanes in Brooklyn Loading bike lane hotspots...
| Bike lane | Crashes
Cyclist injuries
Child injuries
Cyclist deaths |
|---|
What Crashes Cost Here Loading estimate...
Loading crash cost estimate...
The three blocks below show direct costs, other harm, and the total for crashes with injuries, crashes without injuries, and all crashes together.
How we calculate this
We calculate these costs using a method developed by the National Highway Traffic Safety Administration, or NHTSA. It gives one set of costs for crashes with injuries and another for crashes with no reported injuries.
Crashes with injuries cost much more because the method includes things like lost work, medical care, and long-term harm. NHTSA says crash costs include "lost productivity, medical, legal and court costs, emergency service, insurance administration, congestion, property damage, and workplace losses."
These are estimates, not bills. "Other harm" is the part of the broader estimate that goes beyond direct bills and insurance claims. It captures pain, disability, and lost quality of life.
Download the math (CSV) · Download the math (JSON) · Method and sources
Preventable Speeding 14,608 16+ offenders ↓76%
Repeat School-Zone Speeding Offenders
- ≥ 6: 31,827 (2026 year-to-date) • Prev: 130,467 2025 year-to-date
- ≥ 16: 14,608 (2026 year-to-date) • Prev: 61,770 2025 year-to-date
Pedestrian Injuries 97% by Cars and Trucks ↑0.5%
About this chart
We group pedestrian injuries and deaths by the vehicle type that struck them (as recorded in police reports). Use the year selector to compare the current window with the prior period.
- Trucks/Buses, SUVs/Cars, Mopeds, and Bikes reflect the broad categories we use to track vehicle harm.
- Counts include people on foot only; crashes with no injured pedestrians do not appear in this card.
Notes: Police classification can change during investigations. Small categories may have year-to-year variance.
CloseOther Geographies See nearby areas
▸ Other Geographies
Brooklyn Brooklyn sits in District 38, AD 41, SD 17.
It contains Brooklyn CB 1, Brooklyn CB 2, Brooklyn CB 3, Brooklyn CB 4, Brooklyn CB 5, Brooklyn CB 6, Brooklyn CB 7, Brooklyn CB 8, Brooklyn CB 9, Brooklyn CB 10, Brooklyn CB 11, Brooklyn CB 12, Brooklyn CB 13, Brooklyn CB 14, Brooklyn CB 15, Brooklyn CB 16, Brooklyn CB 17, Brooklyn CB 18, Brooklyn CB 55, Brooklyn CB 56, District 33, District 34, District 35, District 36, District 37, District 38, District 39, District 40, District 41, District 42, District 43, District 44, District 45, District 46, District 47, District 48, Greenpoint, Williamsburg, South Williamsburg, East Williamsburg, Brooklyn Heights, Downtown Brooklyn-DUMBO-Boerum Hill, Fort Greene, Clinton Hill, Brooklyn Navy Yard, Bedford-Stuyvesant (West), Bedford-Stuyvesant (East), Bushwick (West), Bushwick (East), The Evergreens Cemetery, Cypress Hills, East New York (North), East New York-New Lots, Spring Creek-Starrett City, East New York-City Line, Highland Park-Cypress Hills Cemeteries (South), Carroll Gardens-Cobble Hill-Gowanus-Red Hook, Park Slope, Windsor Terrace-South Slope, Sunset Park (West), Sunset Park (Central), Green-Wood Cemetery, Prospect Heights, Crown Heights (North), Lincoln Terrace Park, Crown Heights (South), Prospect Lefferts Gardens-Wingate, Bay Ridge, Dyker Heights, Fort Hamilton, Dyker Beach Park, Bensonhurst, Bath Beach, Gravesend (West), Sunset Park (East)-Borough Park (West), Borough Park, Kensington, Mapleton-Midwood (West), Gravesend (South), Coney Island-Sea Gate, Brighton Beach, Calvert Vaux Park, Flatbush, Flatbush (West)-Ditmas Park-Parkville, Midwood, Gravesend (East)-Homecrest, Madison, Sheepshead Bay-Manhattan Beach-Gerritsen Beach, Ocean Hill, Brownsville, East Flatbush-Erasmus, East Flatbush-Farragut, East Flatbush-Rugby, East Flatbush-Remsen Village, Holy Cross Cemetery, Flatlands, Marine Park-Mill Basin-Bergen Beach, Canarsie, Marine Park-Plumb Island, McGuire Fields, Canarsie Park & Pier, Prospect Park, Barren Island-Floyd Bennett Field, Jamaica Bay (West), Shirley Chisholm State Park, Precinct 60, Precinct 61, Precinct 62, Precinct 63, Precinct 66, Precinct 67, Precinct 68, Precinct 69, Precinct 70, Precinct 71, Precinct 72, Precinct 73, Precinct 75, Precinct 76, Precinct 77, Precinct 78, Precinct 79, Precinct 81, Precinct 83, Precinct 84, Precinct 88, Precinct 90, Precinct 94.