Assembly District 57
Crash Narratives
Assembly District 57: 16 crashes in one week, one death
Nov 5–Nov 12 saw 16 crashes in Assembly District 57. One person died. One suffered serious injuries. Seventeen more had moderate injuries.
A violent week hit Assembly District 57. From Nov 5 to Nov 12 there were 16 crashes. One person died. One person suffered serious injuries. Seventeen more had moderate injuries.
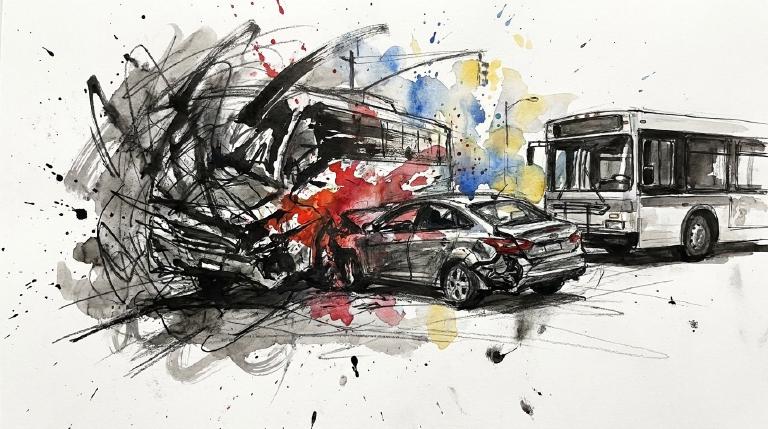
The worst came on the BQE on Nov 8. A 37-year-old passenger fell from a moving SUV. A sedan then struck and killed the person near the Brooklyn Bridge. This district has lit up four times in 90 days. It has lit up four times in 365 days. Assembly Member Phara Souffrant Forrest can push safety bills like A 2299 on intelligent speed assistance and A 803 on bike lane camera enforcement.
- 16 crashes in last 7 days
- 1 serious injury
- 1 death
- A 37-year-old Brooklyn passenger died after falling from a moving SUV and being struck by a sedan near the Brooklyn Bridge.
- A driver and a cyclist were both turning left on Myrtle Avenue when they collided. Police recorded driver inattention; the cyclist suffered a leg and foot contusion.
- A cyclist suffered a shoulder and upper-arm injury and a minor burn in a crash involving a van at Franklin Avenue. The van driver was merging; the cyclist was riding straight.
Assembly District 57: Traffic Crash Statistics
Crash Counter for AD 57 1,226 crashes • 4 deaths
About these crash totals
Counts combine NYC police crash reports (NYPD Motor Vehicle Collisions on NYC Open Data) with CrashCount-reviewed press-confirmed fatal crashes that are awaiting or not yet matched to police records. We sum crashes, injuries, and deaths for this area across the selected time window shown on the card. Injury severity follows DOT's KABCO definitions mapped from the NYPD Person table (injury status, injury type, and injury location) when a police record is available.
- Crashes: police-reported collisions plus reviewed press-confirmed fatal crashes (all road users).
- All injuries: people with any reported injury (KABCO A/B/C or generic "injured").
- Moderate / Serious: suspected minor + suspected serious injuries (KABCO B + A).
- Deaths: killed or apparent death reported by police (KABCO K), plus fatalities confirmed in reviewed press reports before a police record is matched.
Change badges (arrows and percentages) compare the selected window with the same period last year whenever we have enough history. The “From 2022” view shows totals across the full span since 2022. When a comparison window isn’t available the badge shows an em dash.
Notes: Police reports and press-first fatal crash records can be corrected after initial publication. When a press-first record is later matched to a police collision record, CrashCount uses the matched record instead of counting it twice. We cannot verify "death within 30 days" or hospital outcomes, so small differences from DOT totals are possible. Minor incidents without a police report or reviewed fatal press report are not included.
CloseSuperspeeders 1,560 vehicles
October 1, 2025 to September 30, 2026
For each month shown, a superspeeder had at least 16 NYC school-zone speed-camera tickets in the preceding 12 complete calendar months. A vehicle counts once if it received at least one confirmed ticket in this district during a month when it qualified. Superspeeder ticket totals include all that vehicle’s verified tickets in this district across the displayed 12 months, including months when it did not qualify. If a vehicle’s only ticket here during the dates shown came in a month it qualified, it adds one vehicle and one ticket.
Worst offender ranks all vehicles by verified tickets issued in this district during the 12 months shown.
The top five ranks all vehicles by verified tickets issued in this district during the 12 months shown. Each row shows district tickets and that same vehicle’s citywide total. Neighborhood summaries show verified tickets for those same dates.
A verified ticket site within 25 feet of a shared boundary may count in both adjoining areas. We exclude unresolved locations. Each ticket counts once citywide, and each vehicle counts once per district.
94.9% of citywide superspeeder tickets could be assigned to this type of area.
- Superspeeder vehicles
- 1,560
- Superspeeder tickets in district
- 3,808
Top five by district tickets
- Worst offender · 54 tickets in district · 99 citywideNJ T78WPJ · 2024 Honda SporVerified citywide tickets in: Downtown Brooklyn-DUMBO-Boerum Hill (59), Brooklyn Navy Yard (12), and Chelsea-Hudson Yards (8).
- 32 tickets in district · 131 citywideNY LHW5585 · 2024 Gray Toyota SuburbanVerified citywide tickets in: Bedford-Stuyvesant (West) (18), Crown Heights (North) (16), and Fort Greene (13).
- 30 tickets in district · 108 citywideNY 957CN2 · 2026 Black Taro MotorcycleVerified citywide tickets in: Crown Heights (North) (19), Bedford-Stuyvesant (West) (14), and Ocean Hill (9).
- 25 tickets in district · 165 citywideNY LFB3565 · 2023 Black Chrys SuburbanVerified citywide tickets in: Crown Heights (North) (20), Bedford-Stuyvesant (West) (16), and East New York (North) (11).
- 23 tickets in district · 44 citywideGA CSU5356Verified citywide tickets in: Fort Greene (12), Bedford-Stuyvesant (West) (11), and Crown Heights (North) (8).
Dangerous Schools in AD 57 Loading school hotspots...
| School | Crashes
Injuries
Child injuries
Deaths |
|---|
Dangerous Streets in AD 57 Loading street hotspots...
| Street | Crashes
Injuries
Child injuries
Deaths |
|---|
Dangerous Intersections in AD 57 Loading intersection hotspots...
| Intersection | Crashes
Injuries
Child injuries
Deaths |
|---|
Crash Finder
Try Crash Finder
Look up any street, school, address, or intersection to see how safe the streets are.
AD 57 Hot Spots Danger zones and recent crashes
Traffic Safety Timeline Tap to view recent events
Carnage in AD 57 18 Contusion/Bruise (Lower leg/foot)
▸ Killed 4
▸ Crush Injuries 7
▸ Severe Bleeding 1
▸ Severe Lacerations 4
▸ Concussion 6
▸ Fracture/Dislocation 9
▸ Internal Injury 6
▸ Whiplash 46
▸ Contusion/Bruise 59
▸ Abrasion 34
▸ Pain/Nausea 35
Crashes by Hour in AD 57 9 AM • 56 injuries ↑56%
Who is getting hurt? Kids 37 injuries ↓24% Seniors 36 injuries ↓10%
Toggle on at least one mode to see people totals.
Totals count people injured or killed. Use the mode filters above to focus the stacks.
Dangerous Bike Lanes in AD 57 Loading bike lane hotspots...
| Bike lane | Crashes
Cyclist injuries
Child injuries
Cyclist deaths |
|---|
What Crashes Cost Here Loading estimate...
Loading crash cost estimate...
The three blocks below show direct costs, other harm, and the total for crashes with injuries, crashes without injuries, and all crashes together.
How we calculate this
We calculate these costs using a method developed by the National Highway Traffic Safety Administration, or NHTSA. It gives one set of costs for crashes with injuries and another for crashes with no reported injuries.
Crashes with injuries cost much more because the method includes things like lost work, medical care, and long-term harm. NHTSA says crash costs include "lost productivity, medical, legal and court costs, emergency service, insurance administration, congestion, property damage, and workplace losses."
These are estimates, not bills. "Other harm" is the part of the broader estimate that goes beyond direct bills and insurance claims. It captures pain, disability, and lost quality of life.
Download the math (CSV) · Download the math (JSON) · Method and sources
Crash CausesPolice-reported factors
Police-reported contributing factors. Each crash is counted once per factor; a crash can have several factors, so percentages need not total 100%.
Pedestrian Injuries 91% by Cars and Trucks ↓20%
About this chart
We group pedestrian injuries and deaths by the vehicle type that struck them (as recorded in police reports). Use the year selector to compare the current window with the prior period.
- Trucks/Buses, SUVs/Cars, Mopeds, and Bikes reflect the broad categories we use to track vehicle harm.
- Counts include people on foot only; crashes with no injured pedestrians do not appear in this card.
Notes: Police classification can change during investigations. Small categories may have year-to-year variance.
CloseAssembly Member Phara Souffrant Forrest A (100)*
District 57
- 2022-06-02 · Vote · Open States · ↓ hurts gradeSenate passed S 5602 to keep school zone speed cameras running longer. More eyes on reckless drivers. Lawmakers push back against speeding near kids. The vote was clear. The danger remains.
- 2022-05-31 · Vote · Open States · ↓ hurts gradeAssembly and Senate passed A 8933. The bill shields emergency vehicle operators from fines for traffic violations during medical calls. Vulnerable road users face more risk. Accountability weakens. Streets grow more dangerous.
- 2022-05-31 · Vote · Open States · ↓ hurts gradeAssembly and Senate passed A 8933. The bill shields emergency vehicle operators from fines for traffic violations during medical calls. Vulnerable road users face more risk. Accountability weakens. Streets grow more dangerous.
- 2022-05-25 · Vote · Open States · ↓ hurts gradeSenate passed S 5602 to keep school zone speed cameras running longer. More eyes on reckless drivers. Lawmakers push back against speeding near kids. The vote was clear. The danger remains.
- 2022-06-02 · Vote · Open States · ↓ hurts gradeSenate passed S 5602 to keep school zone speed cameras running longer. More eyes on reckless drivers. Lawmakers push back against speeding near kids. The vote was clear. The danger remains.
- 2022-05-31 · Vote · Open States · ↓ hurts gradeAssembly and Senate passed A 8933. The bill shields emergency vehicle operators from fines for traffic violations during medical calls. Vulnerable road users face more risk. Accountability weakens. Streets grow more dangerous.
- 2022-05-31 · Vote · Open States · ↓ hurts gradeAssembly and Senate passed A 8933. The bill shields emergency vehicle operators from fines for traffic violations during medical calls. Vulnerable road users face more risk. Accountability weakens. Streets grow more dangerous.
- 2022-05-25 · Vote · Open States · ↓ hurts gradeSenate passed S 5602 to keep school zone speed cameras running longer. More eyes on reckless drivers. Lawmakers push back against speeding near kids. The vote was clear. The danger remains.
- 2023-07-18 · Leadership · amny.com · ↑ helps gradeBrooklyn officials demand equal tolls on all Manhattan crossings. They warn free bridges funnel traffic into certain neighborhoods. Their letter calls for fairness. The MTA stays silent. The Traffic Mobility Review Board will decide. Streets hang in the balance.
- 2023-06-06 · Vote · Open States · ↑ helps gradeAlbany gets speed cameras near schools. Lawmakers pass A 7043. Cameras catch drivers who endanger kids. The program runs until 2028. Streets near schools face new watchful eyes.
- 2023-06-06 · Vote · Open States · ↑ helps gradeAlbany gets speed cameras near schools. Lawmakers pass A 7043. Cameras catch drivers who endanger kids. The program runs until 2028. Streets near schools face new watchful eyes.
- 2023-06-06 · Vote · Open States · ↑ helps gradeForrest votes yes to require recall checks before used car sales.
- 2023-07-18 · Leadership · amny.com · ↑ helps gradeBrooklyn officials demand equal tolls on all Manhattan crossings. They warn free bridges funnel traffic into certain neighborhoods. Their letter calls for fairness. The MTA stays silent. The Traffic Mobility Review Board will decide. Streets hang in the balance.
- 2023-06-06 · Vote · Open States · ↑ helps gradeAlbany gets speed cameras near schools. Lawmakers pass A 7043. Cameras catch drivers who endanger kids. The program runs until 2028. Streets near schools face new watchful eyes.
- 2023-06-06 · Vote · Open States · ↑ helps gradeAlbany gets speed cameras near schools. Lawmakers pass A 7043. Cameras catch drivers who endanger kids. The program runs until 2028. Streets near schools face new watchful eyes.
- 2023-06-06 · Vote · Open States · ↑ helps gradeForrest votes yes to require recall checks before used car sales.
- 2024-07-11 · Leadership · brooklynpaper.com · ↓ hurts gradeCouncil Member Chi Ossé joined activists at Nostrand Avenue station. They blasted Governor Hochul’s pause on congestion pricing. The delay halts elevator upgrades, trapping seniors, parents, and disabled riders. The street outside roars with traffic. The subway stays out of reach.
- 2024-06-07 · Vote · Open States · ↑ helps gradeAssembly passes A 7652. Schenectady gets school speed cameras. Law aims to slow drivers near kids. Cameras expire in 2028. Vote split. Streets may get safer for children on foot.
- 2024-06-07 · Vote · Open States · ↑ helps gradeAssembly passes A 7652. Schenectady gets school speed cameras. Law aims to slow drivers near kids. Cameras expire in 2028. Vote split. Streets may get safer for children on foot.
- 2024-06-07 · Vote · Open States · ↑ helps gradeLawmakers back speed cameras near Kingston schools. Cameras catch drivers who speed. The bill passed both chambers. It sunsets in 2029. Children and families walk safer, but the fix is temporary.
- 2024-07-11 · Leadership · brooklynpaper.com · ↓ hurts gradeCouncil Member Chi Ossé joined activists at Nostrand Avenue station. They blasted Governor Hochul’s pause on congestion pricing. The delay halts elevator upgrades, trapping seniors, parents, and disabled riders. The street outside roars with traffic. The subway stays out of reach.
- 2024-06-07 · Vote · Open States · ↑ helps gradeAssembly passes A 7652. Schenectady gets school speed cameras. Law aims to slow drivers near kids. Cameras expire in 2028. Vote split. Streets may get safer for children on foot.
- 2024-06-07 · Vote · Open States · ↑ helps gradeAssembly passes A 7652. Schenectady gets school speed cameras. Law aims to slow drivers near kids. Cameras expire in 2028. Vote split. Streets may get safer for children on foot.
- 2024-06-07 · Vote · Open States · ↑ helps gradeLawmakers back speed cameras near Kingston schools. Cameras catch drivers who speed. The bill passed both chambers. It sunsets in 2029. Children and families walk safer, but the fix is temporary.
- 2025-07-22 · Leadership · Streetsblog NYC · ↑ helps gradeDelivery workers get safe battery swaps. No more charging in cramped apartments. Fire risk drops. The city acts. Workers breathe easier. Streets grow safer for all.
- 2025-06-17 · Vote · Open States · ↑ helps gradeSenate passes S 8344. School speed zone rules in New York City get extended. Lawmakers make technical fixes. The bill keeps pressure on drivers near schools. Streets stay a little safer for kids.
- 2025-06-16 · Vote · Open States · ↓ hurts gradeSenate passed S 7785. The bill carves out large Mitchell-Lama housing from bus traffic rules. Lawmakers voted yes. The carve-out weakens enforcement. Streets grow less safe for people on foot and bike.
- 2025-06-16 · Vote · Open States · ↑ helps gradeWhite Plains gets speed cameras near schools. Lawmakers move fast. Most vote yes. Cameras catch drivers who endanger kids. Program ends 2030. Streets may slow. Danger faces children every day.
- 2025-07-22 · Leadership · Streetsblog NYC · ↑ helps gradeDelivery workers get safe battery swaps. No more charging in cramped apartments. Fire risk drops. The city acts. Workers breathe easier. Streets grow safer for all.
- 2025-06-17 · Vote · Open States · ↑ helps gradeSenate passes S 8344. School speed zone rules in New York City get extended. Lawmakers make technical fixes. The bill keeps pressure on drivers near schools. Streets stay a little safer for kids.
- 2025-06-16 · Vote · Open States · ↓ hurts gradeSenate passed S 7785. The bill carves out large Mitchell-Lama housing from bus traffic rules. Lawmakers voted yes. The carve-out weakens enforcement. Streets grow less safe for people on foot and bike.
- 2025-06-16 · Vote · Open States · ↑ helps gradeWhite Plains gets speed cameras near schools. Lawmakers move fast. Most vote yes. Cameras catch drivers who endanger kids. Program ends 2030. Streets may slow. Danger faces children every day.
- 2026-11-17 · Leadership · BKReader · ↑ helps gradeCity Hall and DOT finished Flatbush Avenue’s redesign. It brings 1.9 miles of center-running, barrier-protected bus lanes, plus new boarding islands and curb space for people on foot.
- 2026-06-24 · Leadership · Streetsblog NYC · ↑ helps gradePrimary night shifted power toward livable-streets allies. Streetsblog called it “a huge sweep.” The roundup named winners and losers, not laws or projects. Street danger stayed on the page, not in policy.
- 2026-01-30 · Sponsor · Open StatesForrest co-sponsors climate and community investment act, with no safety impact.
- 2026-11-17 · Leadership · BKReader · ↑ helps gradeCity Hall and DOT finished Flatbush Avenue’s redesign. It brings 1.9 miles of center-running, barrier-protected bus lanes, plus new boarding islands and curb space for people on foot.
- 2026-06-24 · Leadership · Streetsblog NYC · ↑ helps gradePrimary night shifted power toward livable-streets allies. Streetsblog called it “a huge sweep.” The roundup named winners and losers, not laws or projects. Street danger stayed on the page, not in policy.
- 2026-01-30 · Sponsor · Open StatesForrest co-sponsors climate and community investment act, with no safety impact.
- 2025-07-22 · Leadership · Streetsblog NYC · ↑ helps gradeDelivery workers get safe battery swaps. No more charging in cramped apartments. Fire risk drops. The city acts. Workers breathe easier. Streets grow safer for all.
55 Hanson Place, Brooklyn, NY 11217
718-596-0100
Room 731, Legislative Office Building, Albany, NY 12248
518-455-5325
Borough President Antonio Reynoso —
Council Member Crystal Hudson B (71)

District 35
- 2024-12-19 · Vote · NYC Council – Legistar · ↑ helps gradeHudson votes no on bill requiring FDNY input on street projects.
- 2024-12-05 · Sponsor · NYC Council – Legistar · ↑ helps gradeCouncil bill bars cars from blocking crosswalks. No standing or parking within 20 feet. City must install daylighting barriers at 1,000 intersections yearly. Streets clear. Sightlines open. Danger cut.
- 2024-11-13 · Sponsor · NYC Council – Legistar · ↑ helps gradeCouncil demands DOT show its work. The law forces public updates on every street safety project. No more hiding delays. No more silent cost overruns. Progress for bus riders, cyclists, and walkers must be tracked and posted.
- 2024-09-26 · Vote · NYC Council – Legistar · ↑ helps gradeCouncil ends jaywalking penalties. Pedestrians now cross anywhere, any time. No summons. Law strips drivers of excuses. Streets shift. Power tilts to people on foot.
- 2024-11-13 · Sponsor · NYC Council – Legistar · ↑ helps gradeCouncil demands DOT show its work. The law forces public updates on every street safety project. No more hiding delays. No more silent cost overruns. Progress for bus riders, cyclists, and walkers must be tracked and posted.
- 2024-09-26 · Vote · NYC Council – Legistar · ↑ helps gradeCouncil ends jaywalking penalties. Pedestrians now cross anywhere, any time. No summons. Law strips drivers of excuses. Streets shift. Power tilts to people on foot.
- 2024-09-12 · Sponsor · NYC Council – Legistar · ↑ helps gradeHudson co-sponsors bill capping bike share usage fees, no safety impact.
- • Neutral2024-08-15 · Vote · NYC Council – LegistarCity law now forces DOT to reveal where bikes and scooters go. Streets and bridges, protected or not. Data goes public. Riders’ movement, danger, and safety projects laid bare. No more hiding the facts.
- 2025-11-28 · Leadership · Streetsblog NYC · ↑ helps gradeAmanda Farías rode the NYC Ferry to sell a livable‑streets agenda as she campaigns for Council Speaker. She backed congestion pricing, expanded e‑scooters, daylighting, parking‑permit enforcement and transit fixes. This is positioning, not policy.
- 2025-10-09 · Sponsor · NYC Council – Legistar · ↑ helps gradeInt. 1421-2025 would widen outdoor dining: let grocery stores apply for sidewalk licenses, allow roadway cafes year-round, expand frontage for some cafes, and speed approvals. Committee laid it over on Nov. 24, 2025.
- 2025-10-09 · Sponsor · NYC Council – LegistarInt 1421-2025 would let restaurants and grocery stores run sidewalk and roadway cafes in curb or parking lanes year‑round. It speeds reviews, sets $1,050 fees and four‑year terms, and pushes dining closer to moving traffic — raising risks for pedestrians and cyclists.
- 2025-10-09 · Sponsor · NYC Council – LegistarYear‑round expansion of roadway/sidewalk cafes can calm traffic and create buffers that benefit pedestrians, but also risks obstructing sidewalks, complicating winter operations, and creating conflicts near bike lanes. Net safety effects for vulnerable users hinge on strict clear-path, loading, and bike-lane protection rules and enforcement.
- 2025-10-09 · Sponsor · NYC Council – Legistar · ↑ helps gradeInt. 1421-2025 would widen outdoor dining: let grocery stores apply for sidewalk licenses, allow roadway cafes year-round, expand frontage for some cafes, and speed approvals. Committee laid it over on Nov. 24, 2025.
- 2025-10-09 · Sponsor · NYC Council – LegistarInt 1421-2025 would let restaurants and grocery stores run sidewalk and roadway cafes in curb or parking lanes year‑round. It speeds reviews, sets $1,050 fees and four‑year terms, and pushes dining closer to moving traffic — raising risks for pedestrians and cyclists.
- 2025-10-09 · Sponsor · NYC Council – LegistarYear‑round expansion of roadway/sidewalk cafes can calm traffic and create buffers that benefit pedestrians, but also risks obstructing sidewalks, complicating winter operations, and creating conflicts near bike lanes. Net safety effects for vulnerable users hinge on strict clear-path, loading, and bike-lane protection rules and enforcement.
- 2025-10-09 · Sponsor · NYC Council – Legistar · ↓ hurts gradeExpanding sidewalk and roadway cafes citywide and year-round, including winter, increases private use of sidewalks and curb lanes, narrowing pedestrian space and complicating cycling with service crossings and snow/garbage obstructions. While it may displace some parking, the net effect likely elevates conflict and accessibility risks for vulnerable users.
- 2026-11-16 · Leadership · Streetsblog NYC · ↑ helps gradeCity Hall’s e-bike crackdown hit the brakes. Council leaders pushed the package to December at the earliest. A fight over Class 3 bans and policing of deliveristas slowed the vote clock.
- 2026-10-22 · Sponsor · NYC Council – Legistar · ↑ helps gradeInt 1142-2026 would paint curbs red by hydrants and bus stops. It targets illegal stopping and parking. The Council filed it in committee. The clock runs five years.
- 2026-10-22 · Sponsor · NYC Council – Legistar · ↑ helps gradeInt 1153-2026 was introduced Oct. 22, 2026. It would force owners tied to 16 school-zone speed violations to install speed-limiting devices. Noncompliance can bring fines, registration action, and longer terms.
- 2026-10-22 · Sponsor · NYC Council – Legistar · ↑ helps gradeThe Council introduced a pilot to force repeat school-zone speed violators to install speed-limiting tech. Drivers who rack up 16 camera speed tickets in 12 months could face penalties or registration loss for refusing.
- 2026-11-16 · Leadership · Streetsblog NYC · ↑ helps gradeCity Hall’s e-bike crackdown hit the brakes. Council leaders pushed the package to December at the earliest. A fight over Class 3 bans and policing of deliveristas slowed the vote clock.
- 2026-10-22 · Sponsor · NYC Council – Legistar · ↑ helps gradeInt 1142-2026 would paint curbs red by hydrants and bus stops. It targets illegal stopping and parking. The Council filed it in committee. The clock runs five years.
- 2026-10-22 · Sponsor · NYC Council – Legistar · ↑ helps gradeInt 1153-2026 was introduced Oct. 22, 2026. It would force owners tied to 16 school-zone speed violations to install speed-limiting devices. Noncompliance can bring fines, registration action, and longer terms.
- 2026-10-22 · Sponsor · NYC Council – Legistar · ↑ helps gradeThe Council introduced a pilot to force repeat school-zone speed violators to install speed-limiting tech. Drivers who rack up 16 camera speed tickets in 12 months could face penalties or registration loss for refusing.
55 Hanson Place, Suite 778, Brooklyn, NY 11217
718-260-9191
250 Broadway, Suite 1762, New York, NY 10007
212-788-7081
Police Precinct NYPD 88th Precinct —
Other Geographies See nearby areas
▸ Other Geographies
AD 57 Assembly District 57 sits in Brooklyn, District 35, Precinct 88.
It contains Brooklyn CB 2, Fort Greene, Clinton Hill, Bedford-Stuyvesant (West), Crown Heights (South).