Assembly District 43
Crash Narratives
Assembly District 43: Traffic Crash Statistics
Crash Counter for AD 43 566 crashes • 0 deaths
About these crash totals
Counts come from NYC police crash reports (NYPD Motor Vehicle Collisions on NYC Open Data). We sum all crashes, injuries, and deaths for this area across the selected time window shown on the card. Injury severity follows DOT's KABCO definitions mapped from the NYPD Person table (injury status, injury type, and injury location).
- Crashes: number of police‑reported collisions (all road users).
- All injuries: people with any reported injury (KABCO A/B/C or generic "injured").
- Moderate / Serious: suspected minor + suspected serious injuries (KABCO B + A).
- Deaths: killed or apparent death reported by police (KABCO K).
Change badges (arrows and percentages) compare the selected window with the same period last year whenever we have enough history. The “From 2022” view shows totals across the full span since 2022. When a comparison window isn’t available the badge shows an em dash.
Notes: Police reports can be corrected after initial publication. We cannot verify "death within 30 days" or hospital outcomes, so small differences from DOT totals are possible. Minor incidents without a police report are not included.
CloseCaught Speeding in AD 43 KXM7078 — 286 times
- 286 speed-camera tickets citywide in 12 monthsNY KXM7078 · 2022 Gray Ford PickupCaught here 13 times in the last 12 months.Typically speeds citywide in: East New York-New Lots (27), Crown Heights (North) (22), and Concourse-Concourse Village (16).
- 240 speed-camera tickets citywide in 12 monthsNY KWC3138 · 2022 Gray Mitsubishi SuburbanCaught here 1 time in the last 12 months.Typically speeds citywide in: Mount Hope (24), Fordham Heights (18), and Bedford Park (17).
- 228 speed-camera tickets citywide in 12 monthsNC 7M6148 · 2020 Black Harle MotorcycleCaught here 4 times in the last 12 months.Typically speeds citywide in: Ozone Park (71), Howard Beach-Lindenwood (64), and Breezy Point-Belle Harbor-Rockaway Park-Broad Channel (42).
- 206 speed-camera tickets citywide in 12 monthsNY LHW5598 · 2023 Black Toyota SedanCaught here 1 time in the last 12 months.Typically speeds citywide in: Mount Hope (23), Fordham Heights (17), and Claremont Village-Claremont (East) (14).
- 196 speed-camera tickets citywide in 12 monthsGA RUN1724 · 2020 Black BMW MpCaught here 40 times in the last 12 months.Typically speeds citywide in: Crown Heights (North) (88), Prospect Heights (19), and Spring Creek-Starrett City (12).
About this list
This ranks vehicles caught speeding in this area during the latest 12-month window by the number of NYC school-zone speed-camera violations they received anywhere in the city during that same window.
Camera violations are issued by NYC DOT’s program. Counts reflect issued tickets and may omit dismissed or pending cases. Plate text is shown verbatim as recorded.
CloseDangerous Schools in AD 43 Loading school hotspots...
| School | Crashes
Injuries
Child injuries
Deaths |
|---|
Dangerous Streets in AD 43 Loading street hotspots...
| Street | Crashes
Injuries
Child injuries
Deaths |
|---|
Dangerous Intersections in AD 43 Loading intersection hotspots...
| Intersection | Crashes
Injuries
Child injuries
Deaths |
|---|
Crash Finder
Try Crash Finder
Look up any street, school, address, or intersection to see how safe the streets are.
AD 43 Hot Spots Danger zones and recent crashes
Traffic Safety Timeline Tap to view recent events
Carnage in AD 43 12 Contusion/Bruise (Lower leg/foot)
▸ Crush Injuries 1
▸ Severe Bleeding 2
▸ Concussion 3
▸ Fracture/Dislocation 4
▸ Internal Injury 1
▸ Whiplash 16
▸ Contusion/Bruise 34
▸ Abrasion 4
▸ Pain/Nausea 8
Crashes by Hour in AD 43 4 PM • 32 injuries ↑52%
Who is getting hurt? Kids 28 injuries ↓35% Seniors 21 injuries ↓25%
Toggle on at least one mode to see people totals.
Totals count people injured or killed. Use the mode filters above to focus the stacks.
Dangerous Bike Lanes in AD 43 Loading bike lane hotspots...
| Bike lane | Crashes
Cyclist injuries
Child injuries
Cyclist deaths |
|---|
What Crashes Cost Here Loading estimate...
Loading crash cost estimate...
The three blocks below show direct costs, other harm, and the total for crashes with injuries, crashes without injuries, and all crashes together.
How we calculate this
We calculate these costs using a method developed by the National Highway Traffic Safety Administration, or NHTSA. It gives one set of costs for crashes with injuries and another for crashes with no reported injuries.
Crashes with injuries cost much more because the method includes things like lost work, medical care, and long-term harm. NHTSA says crash costs include "lost productivity, medical, legal and court costs, emergency service, insurance administration, congestion, property damage, and workplace losses."
These are estimates, not bills. "Other harm" is the part of the broader estimate that goes beyond direct bills and insurance claims. It captures pain, disability, and lost quality of life.
Download the math (CSV) · Download the math (JSON) · Method and sources
Preventable Speeding 3,095 16+ offenders ↓78%
Repeat School-Zone Speeding Offenders
- ≥ 6: 6,771 (2026 year-to-date) • Prev: 29,297 2025 year-to-date
- ≥ 16: 3,095 (2026 year-to-date) • Prev: 14,117 2025 year-to-date
Pedestrian Injuries 97% by Cars and Trucks ↓15%
About this chart
We group pedestrian injuries and deaths by the vehicle type that struck them (as recorded in police reports). Use the year selector to compare the current window with the prior period.
- Trucks/Buses, SUVs/Cars, Mopeds, and Bikes reflect the broad categories we use to track vehicle harm.
- Counts include people on foot only; crashes with no injured pedestrians do not appear in this card.
Notes: Police classification can change during investigations. Small categories may have year-to-year variance.
CloseAssembly Member Brian Cunningham F (43)*
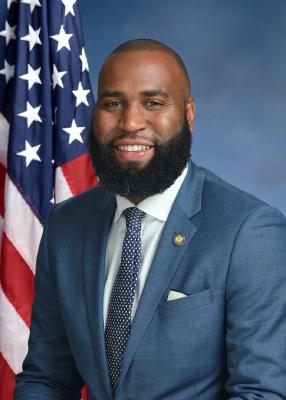
District 43
- 2022-06-02 · Vote · Open States · ↑ helps gradeSenate passed S 5602 to keep school zone speed cameras running longer. More eyes on reckless drivers. Lawmakers push back against speeding near kids. The vote was clear. The danger remains.
- 2022-05-31 · Vote · Open States · ↓ hurts gradeAssembly and Senate passed A 8933. The bill shields emergency vehicle operators from fines for traffic violations during medical calls. Vulnerable road users face more risk. Accountability weakens. Streets grow more dangerous.
- 2022-05-31 · Vote · Open States · ↓ hurts gradeAssembly and Senate passed A 8933. The bill shields emergency vehicle operators from fines for traffic violations during medical calls. Vulnerable road users face more risk. Accountability weakens. Streets grow more dangerous.
- 2022-05-25 · Vote · Open States · ↑ helps gradeSenate passed S 5602 to keep school zone speed cameras running longer. More eyes on reckless drivers. Lawmakers push back against speeding near kids. The vote was clear. The danger remains.
- 2023-12-31 · Leadership · NYC Council – Legistar · ↑ helps gradeCouncil calls for scramble crosswalks at schools. Kids cross in all directions. Cars stop. Fewer deadly conflicts. NYPD cut crossing guards. Streets stay dangerous. Council pushes Albany for action.
- 2023-09-28 · Leadership · NYC Council – Legistar · ↑ helps gradeCouncil calls for scramble crosswalks at schools. Kids cross in all directions. Cars stop. Fewer deadly conflicts. NYPD cut crossing guards. Streets stay dangerous. Council pushes Albany for action.
- 2023-09-28 · Leadership · NYC Council – Legistar · ↑ helps gradeCouncil calls for scramble crosswalks at schools. Kids cross in all directions. Cars stop. Fewer deadly conflicts. NYPD cut crossing guards. Streets stay dangerous. Council pushes Albany for action.
- 2023-09-28 · Leadership · NYC Council – Legistar · ↑ helps gradeCouncil calls for scramble crosswalks at school zones. Kids cross in all directions. Cars stop. Too many crashes near schools. NYPD cut crossing guards. Council wants state to act. Session ended, bill filed.
- 2023-06-07 · Leadership · Streetsblog NYCMothers starve for Sammy’s Law. Hochul offers sympathy, not action. Heastie keeps the bill off the floor. The law would let New York City lower speed limits. Assembly support grows. Vulnerable road users wait. Streets stay deadly. Lawmakers stall. Lives hang in the balance.
- 2023-06-06 · Vote · Open States · ↑ helps gradeAlbany gets speed cameras near schools. Lawmakers pass A 7043. Cameras catch drivers who endanger kids. The program runs until 2028. Streets near schools face new watchful eyes.
- 2023-06-06 · Vote · Open States · ↑ helps gradeAlbany gets speed cameras near schools. Lawmakers pass A 7043. Cameras catch drivers who endanger kids. The program runs until 2028. Streets near schools face new watchful eyes.
- 2023-06-06 · Vote · Open States · ↑ helps gradeCunningham votes yes to require recall checks before used car sales.
- 2024-12-12 · Leadership · amny.com · ↑ helps gradeMaritza Davila endorsed Mark Levine’s run for Comptroller. Levine vows to cut living costs, build housing, and make streets safer. He supports congestion pricing and more cycling lanes. Davila’s support signals a push for citywide safety and accountability.
- 👍 Positive2024-06-07 · Vote · Open States · ↑ helps gradeAssembly passes A 7652. Schenectady gets school speed cameras. Law aims to slow drivers near kids. Cameras expire in 2028. Vote split. Streets may get safer for children on foot.
- 👍 Positive2024-06-07 · Vote · Open States · ↑ helps gradeAssembly passes A 7652. Schenectady gets school speed cameras. Law aims to slow drivers near kids. Cameras expire in 2028. Vote split. Streets may get safer for children on foot.
- 2024-06-07 · Vote · Open States · ↑ helps gradeLawmakers back speed cameras near Kingston schools. Cameras catch drivers who speed. The bill passed both chambers. It sunsets in 2029. Children and families walk safer, but the fix is temporary.
- 👍 Positive2024-06-07 · Vote · Open States · ↑ helps gradeAssembly passes A 7652. Schenectady gets school speed cameras. Law aims to slow drivers near kids. Cameras expire in 2028. Vote split. Streets may get safer for children on foot.
- 👍 Positive2024-06-07 · Vote · Open States · ↑ helps gradeAssembly passes A 7652. Schenectady gets school speed cameras. Law aims to slow drivers near kids. Cameras expire in 2028. Vote split. Streets may get safer for children on foot.
- 2024-06-07 · Vote · Open States · ↑ helps gradeLawmakers back speed cameras near Kingston schools. Cameras catch drivers who speed. The bill passed both chambers. It sunsets in 2029. Children and families walk safer, but the fix is temporary.
- 2024-06-06 · Leadership · nypost.com · ↓ hurts gradeCouncil members slam Hochul’s last-minute NYC tax hike to replace congestion pricing. Transit funding hangs in limbo. Liz Krueger says the tax lacks support. Riders and workers face uncertainty as lawmakers reject new burdens and demand fairer solutions.
- 2025-12-11 · Leadership · Streetsblog NYC · ↓ hurts gradeWatchdog slams S6815/A8292, a bus-lane shield for MTA staff, warning it hands free reign to agency vehicles while riders wait and walkers dodge steel.
- 2025-06-25 · Leadership · Streetsblog NYC · ↑ helps gradeAlbany stalled. Lawmakers dragged their feet. No new laws for safer streets. Pedestrians and cyclists left exposed. The car stays king. The status quo kills. Vulnerable New Yorkers pay the price.
- 2025-06-17 · Vote · Open States · ↓ hurts gradeSenate passes S 8344. School speed zone rules in New York City get extended. Lawmakers make technical fixes. The bill keeps pressure on drivers near schools. Streets stay a little safer for kids.
- 2025-06-16 · Vote · Open States · ↓ hurts gradeSenate passed S 7785. The bill carves out large Mitchell-Lama housing from bus traffic rules. Lawmakers voted yes. The carve-out weakens enforcement. Streets grow less safe for people on foot and bike.
- 2025-06-11 · Vote · Open States · ↓ hurts gradeSenate passed S 7785. The bill carves out large Mitchell-Lama housing from bus traffic rules. Lawmakers voted yes. The carve-out weakens enforcement. Streets grow less safe for people on foot and bike.
- 2025-06-11 · Vote · Open States · ↑ helps gradeWhite Plains gets speed cameras near schools. Lawmakers move fast. Most vote yes. Cameras catch drivers who endanger kids. Program ends 2030. Streets may slow. Danger faces children every day.
- 2025-05-09 · Sponsor · Open States · ↓ hurts gradeCunningham sponsors bill to clarify bus lane restrictions in NYC.
- 2025-05-07 · Vote · Open States · ↑ helps gradeCunningham votes yes on transportation budget bill with no safety impact.
- 2026-06-10 · Leadership · Streetsblog NYC · ↑ helps gradeStreetsPAC dropped its slate before the June 23 primary. It backed candidates who talk about safer streets and less car rule. It was politics, not policy. No street changed that day.
- 2026-05-07 · Leadership · Streetsblog Empire State · ↑ helps gradeA must-pass budget now carries the “Stop Super Speeders” plan. It targets repeat speed-camera violators for speed-limiting tech. The details are still in flux.
- 2026-04-08 · Sponsor · Open States · ↓ hurts gradeA 10914 would give DSNY a liability defense for bus-lane stops. The move eases consequences when sanitation trucks block lanes. Pedestrians and cyclists pay when big vehicles sit where they should not.
- 2026-03-27 · Leadership · AMNY · ↑ helps gradeExperts warned the AV industry is “incredibly opaque.” They pressed for data sharing and independent oversight before fully driverless cars enter NYC streets.
249 Empire Blvd., Brooklyn, NY 11225
718-771-3105
Room 555, Legislative Office Building, Albany, NY 12248
518-455-5262
Borough President Antonio Reynoso —
Council Member Rita C. Joseph A (100)

District 40
- 2024-12-19 · Vote · NYC Council – Legistar · ↑ helps gradeJoseph votes no on bill requiring FDNY input on street projects.
- 2024-12-05 · Sponsor · NYC Council – Legistar · ↑ helps gradeCouncil bill bars cars from blocking crosswalks. No standing or parking within 20 feet. City must install daylighting barriers at 1,000 intersections yearly. Streets clear. Sightlines open. Danger cut.
- 2024-11-13 · Sponsor · NYC Council – Legistar · ↑ helps gradeCouncil demands DOT show its work. The law forces public updates on every street safety project. No more hiding delays. No more silent cost overruns. Progress for bus riders, cyclists, and walkers must be tracked and posted.
- 2024-09-26 · Vote · NYC Council – Legistar · ↑ helps gradeCouncil ends jaywalking penalties. Pedestrians now cross anywhere, any time. No summons. Law strips drivers of excuses. Streets shift. Power tilts to people on foot.
- 2024-04-26 · Leadership · Streetsblog NYC · ↑ helps gradeBrooklyn Community Board 9 wants a protected bike lane on Empire Boulevard. The board passed a resolution after years of crashes and deaths. Cyclists and pedestrians have paid the price. Local officials back the call. DOT has not acted.
- 2024-02-28 · Sponsor · NYC Council – LegistarCouncil bill would pay up to $1,000 for tips that help catch hit-and-run drivers who injure or kill. Police and city workers are barred from rewards. The measure targets unsolved crashes that leave victims behind.
- 2024-02-28 · Sponsor · NYC Council – Legistar · ↑ helps gradeCouncil bill orders speed humps on roads beside parks over one acre. DOT can skip spots if safety or rules demand. Law aims to slow cars where families walk, run, and play.
- 2024-02-28 · Sponsor · NYC Council – Legistar · ↑ helps gradeCouncil bill orders DOT to probe crashes. Expands what counts as serious. Sets tight deadlines. Demands detailed reports. Pushes city to face the wreckage, not hide it.
- 2025-06-30 · Vote · NYC Council – Legistar · ↑ helps gradeCouncil orders swift removal of abandoned, derelict cars. Streets clear in 72 hours. No plates, no stickers, no excuses. Police and sanitation must act. Safer crossings for all who walk, ride, or wait.
- 2025-05-01 · Vote · NYC Council – LegistarCouncil passes law. Taxis and for-hire cars must post bold warnings on rear doors. Riders face the message: look for cyclists before swinging the door. A move to cut dooring. City acts. Cyclists stay in the crosshairs.
- 2025-04-10 · Vote · NYC Council – Legistar · ↑ helps gradeCouncil passed a law forcing DOT to post sharp, regular updates on street safety projects. Progress on bike lanes, bus lanes, and signals must go public. No more hiding delays or cost overruns. The city must show its work.
- 2025-02-13 · Vote · NYC Council – Legistar · ↑ helps gradeCouncil orders DOT to repaint pavement lines within five days after resurfacing. Delays must be explained to the public. Clear markings mean fewer deadly gaps for walkers and riders.
- 2026-05-14 · Sponsor · NYC Council – LegistarJoseph primarily sponsors resolution urging state to pass assault-after-harassment law
- 2026-02-12 · Sponsor · NYC Council – Legistar · ↑ helps gradeInt 0613-2026 would force faster protected bike-lane buildout. It is in the Transportation and Infrastructure Committee after a Feb. 12 introduction. The goal: physical space for cyclists, year after year.
- 2026-02-12 · Leadership · NYC Council – Legistar · ↑ helps gradeInt 0605-2026 targets fast streets beside parks. It orders DOT to install speed humps near parks of at least one acre. But DOT can say no under its judgment and guidelines.
- 2026-02-12 · Leadership · NYC Council – Legistar · ↑ helps gradeInt 0605-2026 targets fast streets beside parks. It orders DOT to install speed humps near parks of at least one acre. But DOT can say no under its judgment and guidelines.
930 Flatbush Avenue, Brooklyn, NY 11226
718-287-8762
250 Broadway, Suite 1752, New York, NY 10007
212-788-7352
Police Precinct NYPD 71st Precinct —
Other Geographies See nearby areas
▸ Other Geographies
AD 43 Assembly District 43 sits in Brooklyn, District 40, Precinct 71.
It contains Brooklyn CB 8, Brooklyn CB 9, Crown Heights (North), Crown Heights (South), Prospect Lefferts Gardens-Wingate, East Flatbush-Erasmus.
▸ See also
