Assembly District 34
Crash Narratives
Assembly District 34: Traffic Crash Statistics
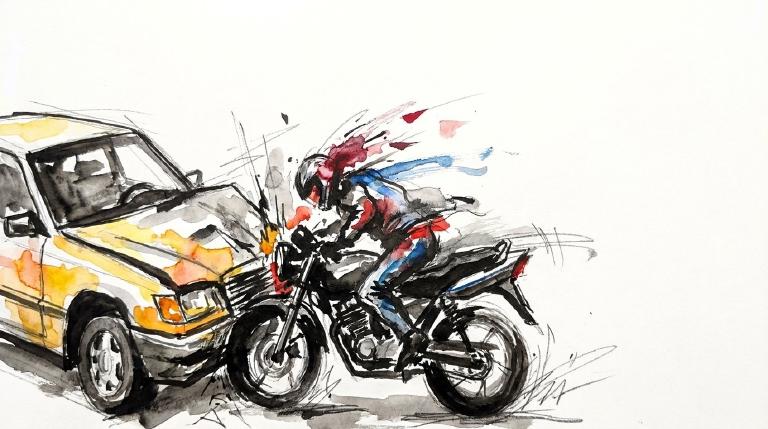
Crash Counter for AD 34 836 crashes • 3 deaths
About these crash totals
Counts combine NYC police crash reports (NYPD Motor Vehicle Collisions on NYC Open Data) with CrashCount-reviewed press-confirmed fatal crashes that are awaiting or not yet matched to police records. We sum crashes, injuries, and deaths for this area across the selected time window shown on the card. Injury severity follows DOT's KABCO definitions mapped from the NYPD Person table (injury status, injury type, and injury location) when a police record is available.
- Crashes: police-reported collisions plus reviewed press-confirmed fatal crashes (all road users).
- All injuries: people with any reported injury (KABCO A/B/C or generic "injured").
- Moderate / Serious: suspected minor + suspected serious injuries (KABCO B + A).
- Deaths: killed or apparent death reported by police (KABCO K), plus fatalities confirmed in reviewed press reports before a police record is matched.
Change badges (arrows and percentages) compare the selected window with the same period last year whenever we have enough history. The “From 2022” view shows totals across the full span since 2022. When a comparison window isn’t available the badge shows an em dash.
Notes: Police reports and press-first fatal crash records can be corrected after initial publication. When a press-first record is later matched to a police collision record, CrashCount uses the matched record instead of counting it twice. We cannot verify "death within 30 days" or hospital outcomes, so small differences from DOT totals are possible. Minor incidents without a police report or reviewed fatal press report are not included.
CloseCaught Speeding in AD 34 LUNO — 177 times
- 177 speed-camera tickets citywide in 12 monthsNY LUNO · 2023 White RAM PickupCaught here 3 times in the last 12 months.Typically speeds citywide in: Auburndale (27), Jamaica Estates-Holliswood (26), and Pomonok-Electchester-Hillcrest (14).
- 167 speed-camera tickets citywide in 12 monthsNC CBK7202 · 2005 Chevrolet 4SCaught here 24 times in the last 12 months.Typically speeds citywide in: Astoria (North)-Ditmars-Steinway (30), Elmhurst (17), and Ozone Park (15).
- 165 speed-camera tickets citywide in 12 monthsNY LFB3565 · 2023 Black Chrys SuburbanCaught here 1 time in the last 12 months.Typically speeds citywide in: Crown Heights (North) (17), Bedford-Stuyvesant (West) (16), and East New York (North) (11).
- 165 speed-camera tickets citywide in 12 monthsNJ A35WNJ · 2024 Audi SedaCaught here 1 time in the last 12 months.Typically speeds citywide in: East Flatbush-Remsen Village (17), East Flatbush-Rugby (15), and Crown Heights (North) (14).
- 153 speed-camera tickets citywide in 12 monthsIL GB70712 · 2020 BMW SedaCaught here 2 times in the last 12 months.Typically speeds citywide in: Rego Park (23), Bayside (12), and Elmhurst (11).
About this list
This ranks vehicles caught speeding in this area during the latest 12-month window by the number of NYC school-zone speed-camera violations they received anywhere in the city during that same window.
Camera violations are issued by NYC DOT’s program. Counts reflect issued tickets and may omit dismissed or pending cases. Plate text is shown verbatim as recorded.
CloseDangerous Schools in AD 34 Loading school hotspots...
| School | Crashes
Injuries
Child injuries
Deaths |
|---|
Dangerous Streets in AD 34 Loading street hotspots...
| Street | Crashes
Injuries
Child injuries
Deaths |
|---|
Dangerous Intersections in AD 34 Loading intersection hotspots...
| Intersection | Crashes
Injuries
Child injuries
Deaths |
|---|
Crash Finder
Try Crash Finder
Look up any street, school, address, or intersection to see how safe the streets are.
AD 34 Hot Spots Danger zones and recent crashes
Traffic Safety Timeline Tap to view recent events
Carnage in AD 34 14 Whiplash (Neck)
▸ Killed 3
▸ Crush Injuries 1
▸ Severe Bleeding 3
▸ Concussion 4
▸ Fracture/Dislocation 8
▸ Internal Injury 5
▸ Whiplash 37
▸ Contusion/Bruise 44
▸ Abrasion 25
▸ Pain/Nausea 18
Crashes by Hour in AD 34 4 PM • 35 injuries ↑40%
Who is getting hurt? Kids 33 injuries ↓15% Seniors 30 injuries ↓33%
Toggle on at least one mode to see people totals.
Totals count people injured or killed. Use the mode filters above to focus the stacks.
Dangerous Bike Lanes in AD 34 Loading bike lane hotspots...
| Bike lane | Crashes
Cyclist injuries
Child injuries
Cyclist deaths |
|---|
What Crashes Cost Here Loading estimate...
Loading crash cost estimate...
The three blocks below show direct costs, other harm, and the total for crashes with injuries, crashes without injuries, and all crashes together.
How we calculate this
We calculate these costs using a method developed by the National Highway Traffic Safety Administration, or NHTSA. It gives one set of costs for crashes with injuries and another for crashes with no reported injuries.
Crashes with injuries cost much more because the method includes things like lost work, medical care, and long-term harm. NHTSA says crash costs include "lost productivity, medical, legal and court costs, emergency service, insurance administration, congestion, property damage, and workplace losses."
These are estimates, not bills. "Other harm" is the part of the broader estimate that goes beyond direct bills and insurance claims. It captures pain, disability, and lost quality of life.
Download the math (CSV) · Download the math (JSON) · Method and sources
Preventable Speeding 2,963 16+ offenders ↓44%
Repeat School-Zone Speeding Offenders
- ≥ 6: 8,275 (2026 year-to-date) • Prev: 13,612 2025 year-to-date
- ≥ 16: 2,963 (2026 year-to-date) • Prev: 5,298 2025 year-to-date
Pedestrian Injuries 94% by Cars and Trucks ↓15%
About this chart
We group pedestrian injuries and deaths by the vehicle type that struck them (as recorded in police reports). Use the year selector to compare the current window with the prior period.
- Trucks/Buses, SUVs/Cars, Mopeds, and Bikes reflect the broad categories we use to track vehicle harm.
- Counts include people on foot only; crashes with no injured pedestrians do not appear in this card.
Notes: Police classification can change during investigations. Small categories may have year-to-year variance.
CloseAssembly Member Jessica González-Rojas A (100)*
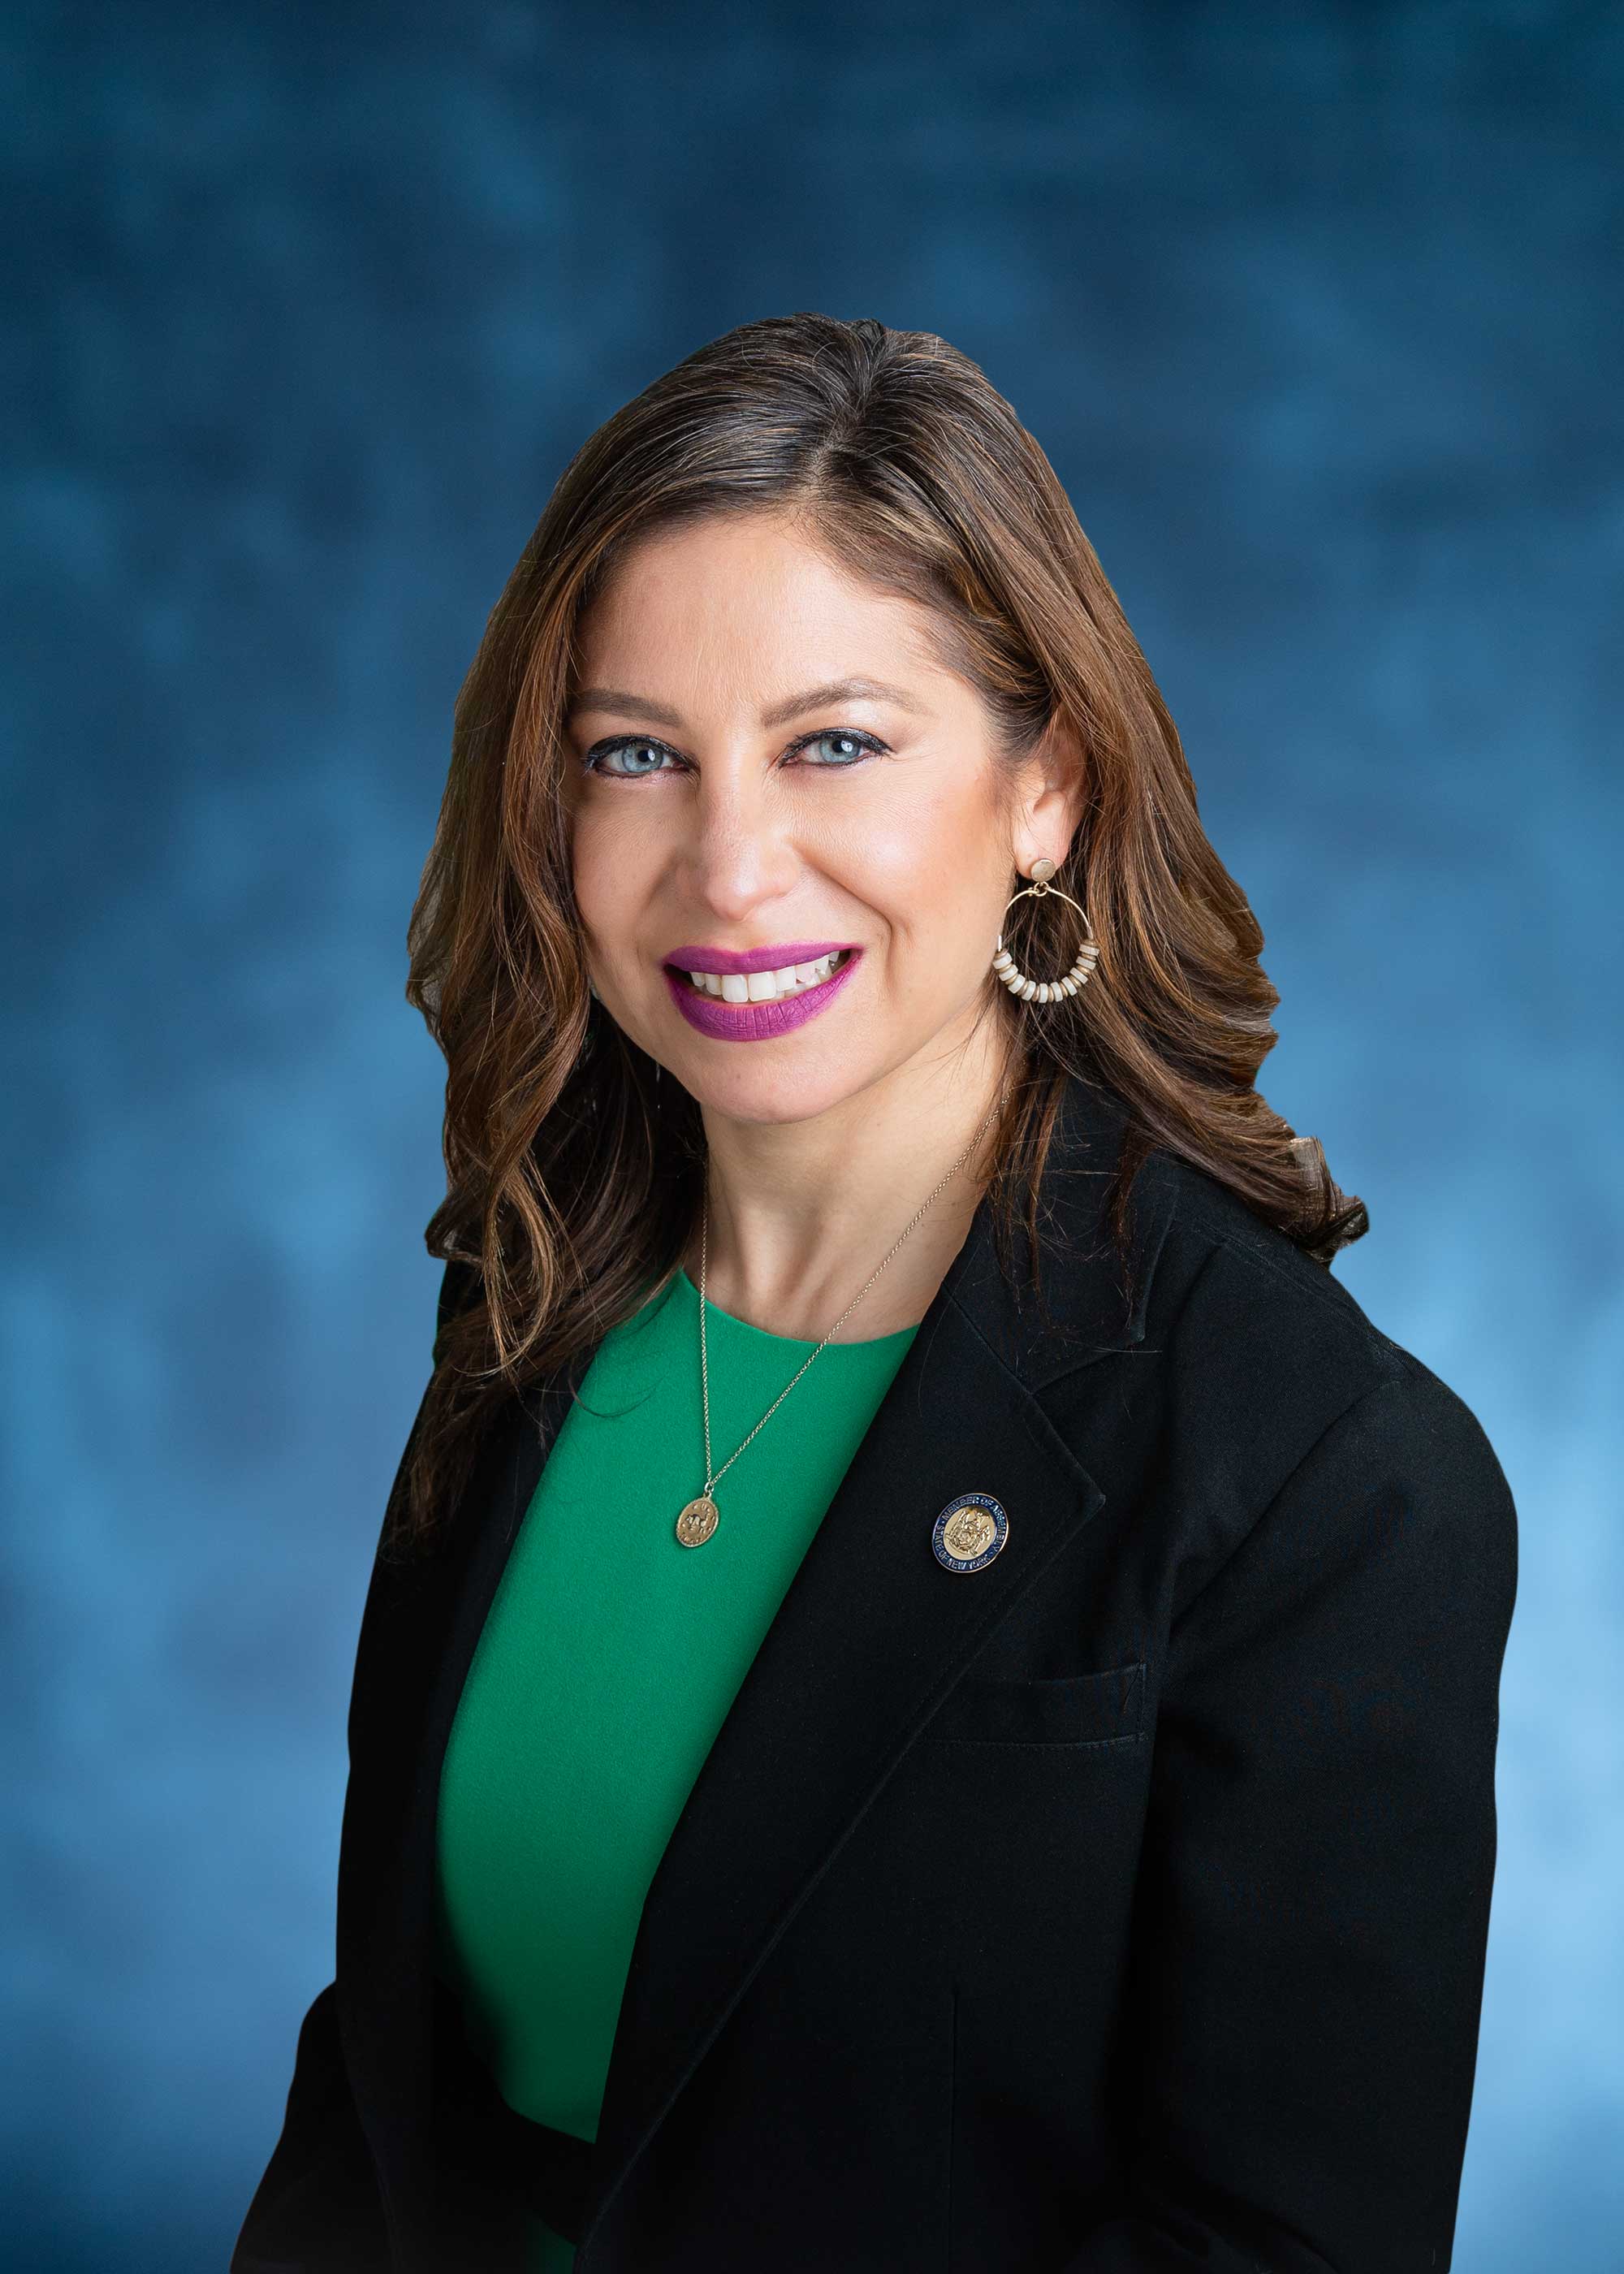
District 34
- 2022-11-07 · Leadership · Streetsblog NYC · ↑ helps gradeQueens Community Board 2 voted to block a new SUV dealership on Northern Boulevard. Local leaders demand housing, not more cars. They cite danger, pollution, and reckless driving. Council Member Julie Won and Assembly Member González-Rojas back the board. The fight moves to City Planning.
- 2022-11-01 · Leadership · amny.com · ↓ hurts gradeBus lanes crawl while people die. Advocates and Assemblymember Jessica González-Rojas rally on Northern Boulevard. Only 5.4 miles built, far short of the 20-mile goal. The city stalls. Streets stay deadly. Families mourn. The clock runs out.
- 2022-10-26 · Leadership · Streetsblog NYC · ↑ helps gradeCyclists can now cross the Cross Bay Bridge. The Henry Hudson Bridge will follow after renovations. Assembly Member Gonzalez-Rojas pushed the law. Advocates pressed the MTA. Progress is slow, but real. Bike access grows. Riders still face gaps and delays.
- 2022-06-02 · Vote · Open States · ↑ helps gradeSenate passed S 5602 to keep school zone speed cameras running longer. More eyes on reckless drivers. Lawmakers push back against speeding near kids. The vote was clear. The danger remains.
- 2022-11-01 · Leadership · amny.com · ↓ hurts gradeBus lanes crawl while people die. Advocates and Assemblymember Jessica González-Rojas rally on Northern Boulevard. Only 5.4 miles built, far short of the 20-mile goal. The city stalls. Streets stay deadly. Families mourn. The clock runs out.
- 2022-10-26 · Leadership · Streetsblog NYC · ↑ helps gradeCyclists can now cross the Cross Bay Bridge. The Henry Hudson Bridge will follow after renovations. Assembly Member Gonzalez-Rojas pushed the law. Advocates pressed the MTA. Progress is slow, but real. Bike access grows. Riders still face gaps and delays.
- 2022-06-02 · Vote · Open States · ↑ helps gradeSenate passed S 5602 to keep school zone speed cameras running longer. More eyes on reckless drivers. Lawmakers push back against speeding near kids. The vote was clear. The danger remains.
- 2022-05-31 · Vote · Open States · ↓ hurts gradeAssembly and Senate passed A 8933. The bill shields emergency vehicle operators from fines for traffic violations during medical calls. Vulnerable road users face more risk. Accountability weakens. Streets grow more dangerous.
- 2023-08-18 · Sponsor · Open States · ↑ helps gradeAssembly bill A 7979 targets reckless drivers. Eleven points or six camera tickets triggers a speed limiter. Lawmakers move to curb repeat danger. No more unchecked speeding. Streets demand it.
- 2023-08-18 · Sponsor · Open States · ↑ helps gradeGonzalez-Rojas co-sponsors bill to change registration fees for some vehicles.
- 2023-06-13 · Leadership · Streetsblog NYC · ↓ hurts gradeAlbany failed New York’s streets. Lawmakers blocked Sammy’s Law and other safety bills. Cyclists, pedestrians, and bus riders lost. Car culture ruled. Advocates called it a wasted session. Only transit funding and a bus pilot survived. No real progress for the vulnerable.
- 2023-06-06 · Vote · Open States · ↑ helps gradeAlbany gets speed cameras near schools. Lawmakers pass A 7043. Cameras catch drivers who endanger kids. The program runs until 2028. Streets near schools face new watchful eyes.
- 2023-08-18 · Sponsor · Open States · ↑ helps gradeAssembly bill A 7979 targets reckless drivers. Eleven points or six camera tickets triggers a speed limiter. Lawmakers move to curb repeat danger. No more unchecked speeding. Streets demand it.
- 2023-08-18 · Sponsor · Open States · ↑ helps gradeGonzalez-Rojas co-sponsors bill to change registration fees for some vehicles.
- 2023-06-13 · Leadership · Streetsblog NYC · ↓ hurts gradeAlbany failed New York’s streets. Lawmakers blocked Sammy’s Law and other safety bills. Cyclists, pedestrians, and bus riders lost. Car culture ruled. Advocates called it a wasted session. Only transit funding and a bus pilot survived. No real progress for the vulnerable.
- 2023-06-06 · Vote · Open States · ↑ helps gradeAlbany gets speed cameras near schools. Lawmakers pass A 7043. Cameras catch drivers who endanger kids. The program runs until 2028. Streets near schools face new watchful eyes.
- 2024-09-25 · Leadership · Streetsblog NYC · ↑ helps gradeThe Cross Bay Bridge’s deadly ramp is gone. In its place: a wide, gentle slope. Pedestrians, cyclists, wheelchair users now cross safely. The upgrade, forced by a 2021 law, marks progress. But other bridges still leave vulnerable users stranded. Advocates demand more.
- 2024-06-11 · Leadership · gothamist.com · ↑ helps gradeCouncilmember Shekar Krishnan called out the surge of reckless mopeds and e-bikes on 34th Avenue. Residents spoke of fear, injury, and death. City officials promised enforcement and education. Advocates demanded safer streets, not criminalization. The crisis rolls on. Action lags.
- 2024-06-11 · Leadership · Streetsblog NYCCouncil Member Shekar Krishnan blasted DOT for chaos on 34th Avenue’s Paseo Park. He called it a ‘moped highway’ and demanded a redesign. Pedestrians dodge speeding mopeds. Painted bike lanes fail. DOT touts safety, but danger remains for those on foot.
- 👍 Positive2024-06-07 · Vote · Open States · ↑ helps gradeAssembly passes A 7652. Schenectady gets school speed cameras. Law aims to slow drivers near kids. Cameras expire in 2028. Vote split. Streets may get safer for children on foot.
- 2024-09-25 · Leadership · Streetsblog NYC · ↑ helps gradeThe Cross Bay Bridge’s deadly ramp is gone. In its place: a wide, gentle slope. Pedestrians, cyclists, wheelchair users now cross safely. The upgrade, forced by a 2021 law, marks progress. But other bridges still leave vulnerable users stranded. Advocates demand more.
- 2024-06-11 · Leadership · gothamist.com · ↑ helps gradeCouncilmember Shekar Krishnan called out the surge of reckless mopeds and e-bikes on 34th Avenue. Residents spoke of fear, injury, and death. City officials promised enforcement and education. Advocates demanded safer streets, not criminalization. The crisis rolls on. Action lags.
- 2024-06-11 · Leadership · Streetsblog NYCCouncil Member Shekar Krishnan blasted DOT for chaos on 34th Avenue’s Paseo Park. He called it a ‘moped highway’ and demanded a redesign. Pedestrians dodge speeding mopeds. Painted bike lanes fail. DOT touts safety, but danger remains for those on foot.
- 👍 Positive2024-06-07 · Vote · Open States · ↑ helps gradeAssembly passes A 7652. Schenectady gets school speed cameras. Law aims to slow drivers near kids. Cameras expire in 2028. Vote split. Streets may get safer for children on foot.
- 2025-08-19 · Leadership · AMNY · ↑ helps gradeLocal officials backed DOT's protected bike lanes under the elevated 31st Street tracks. A New York State Supreme Court issued a temporary injunction that paused the plan. Leaders urged the city to move the separated lanes forward to protect cyclists and pedestrians.
- 2025-08-12 · Leadership · Streetsblog NYC · ↑ helps gradeA speeding 84-year-old driver killed himself and two pedestrians in Astoria. Elected officials demanded 20 mph limits, protected bike lanes, universal daylighting, and more automated enforcement. Analysts say systemwide changes reduce traffic violence and protect pedestrians and cyclists.
- 2025-08-08 · Leadership · Streetsblog NYC · ↑ helps gradeDOT will install protected bike lanes and traffic calming on 31st Street in Astoria. Business owners sued to stop it. The corridor has 190 injuries, 12 severe, 2 deaths since 2020. DOT vows to defend the redesign.
- 2025-06-30 · Leadership · NYC Council – Legistar · ↑ helps gradeGonzález-Rojas Backs Safety-Boosting Half Fare Transit Discount
- 2025-08-19 · Leadership · AMNY · ↑ helps gradeLocal officials backed DOT's protected bike lanes under the elevated 31st Street tracks. A New York State Supreme Court issued a temporary injunction that paused the plan. Leaders urged the city to move the separated lanes forward to protect cyclists and pedestrians.
- 2025-08-12 · Leadership · Streetsblog NYC · ↑ helps gradeA speeding 84-year-old driver killed himself and two pedestrians in Astoria. Elected officials demanded 20 mph limits, protected bike lanes, universal daylighting, and more automated enforcement. Analysts say systemwide changes reduce traffic violence and protect pedestrians and cyclists.
- 2025-08-08 · Leadership · Streetsblog NYC · ↑ helps gradeDOT will install protected bike lanes and traffic calming on 31st Street in Astoria. Business owners sued to stop it. The corridor has 190 injuries, 12 severe, 2 deaths since 2020. DOT vows to defend the redesign.
- 2025-06-30 · Leadership · NYC Council – Legistar · ↑ helps gradeGonzález-Rojas Backs Safety-Boosting Half Fare Transit Discount
- 2026-06-24 · Leadership · Streetsblog NYC · ↑ helps gradePrimary night shifted power toward livable-streets allies. Streetsblog called it “a huge sweep.” The roundup named winners and losers, not laws or projects. Street danger stayed on the page, not in policy.
- 2026-06-10 · Leadership · Streetsblog NYC · ↑ helps gradeStreetsPAC dropped its slate before the June 23 primary. It backed candidates who talk about safer streets and less car rule. It was politics, not policy. No street changed that day.
- 2026-04-14 · Leadership · AMNY · ↑ helps gradeApril 14, Gonzalez-Rojas pressed the MTA for lifts at four Queens 7 stops. Stair-only stations force detours and dependence. Elevators would open the system to riders left on the steps.
- 2026-01-30 · Sponsor · Open StatesGonzalez-Rojas co-sponsors climate and community investment act, with no safety impact.
- 2026-06-24 · Leadership · Streetsblog NYC · ↑ helps gradePrimary night shifted power toward livable-streets allies. Streetsblog called it “a huge sweep.” The roundup named winners and losers, not laws or projects. Street danger stayed on the page, not in policy.
- 2026-06-10 · Leadership · Streetsblog NYC · ↑ helps gradeStreetsPAC dropped its slate before the June 23 primary. It backed candidates who talk about safer streets and less car rule. It was politics, not policy. No street changed that day.
- 2026-04-14 · Leadership · AMNY · ↑ helps gradeApril 14, Gonzalez-Rojas pressed the MTA for lifts at four Queens 7 stops. Stair-only stations force detours and dependence. Elevators would open the system to riders left on the steps.
- 2026-01-30 · Sponsor · Open StatesGonzalez-Rojas co-sponsors climate and community investment act, with no safety impact.
75-35 31st Ave. Suite 206B (2nd Floor), East Elmhurst, NY 11370
718-457-0384
Room 654, Legislative Office Building, Albany, NY 12248
518-455-4545
Borough President Donovan Richards Jr. —
Council Member Tiffany Cabán A (100)
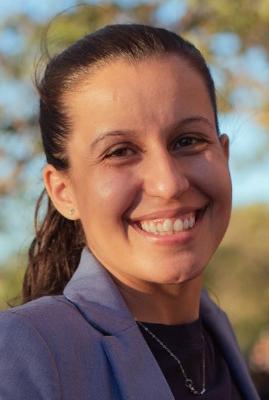
District 22
- 2024-12-19 · Sponsor · NYC Council – Legistar · ↑ helps gradeCouncil moves to test bold pavement markings at crash sites. Five spots per borough. Focus: places where drivers have killed or maimed. Report to follow. Streets marked for danger.
- 2024-12-19 · Vote · NYC Council – Legistar · ↓ hurts gradeCabán abstains from vote on fire department consultation for street projects.
- 2024-12-05 · Sponsor · NYC Council – Legistar · ↑ helps gradeCouncil bill bars cars from blocking crosswalks. No standing or parking within 20 feet. City must install daylighting barriers at 1,000 intersections yearly. Streets clear. Sightlines open. Danger cut.
- 2024-09-26 · Vote · NYC Council – Legistar · ↑ helps gradeCouncil ends jaywalking penalties. Pedestrians now cross anywhere, any time. No summons. Law strips drivers of excuses. Streets shift. Power tilts to people on foot.
- 2024-09-26 · Vote · NYC Council – Legistar · ↑ helps gradeCouncil ends jaywalking penalties. Pedestrians now cross anywhere, any time. No summons. Law strips drivers of excuses. Streets shift. Power tilts to people on foot.
- 2024-09-23 · Leadership · gothamist.com · ↑ helps gradeCouncil pulled the jaywalking decriminalization bill before a vote. Advocates warned it could shield drivers who hit pedestrians. NYPD tickets mostly Black and Hispanic New Yorkers. Councilmember Cabán says the law enables biased policing. Streets remain dangerous for those on foot.
- 2024-09-12 · Sponsor · NYC Council – Legistar · ↑ helps gradeCabán co-sponsors bill capping bike share usage fees, no safety impact.
- 2024-08-15 · Vote · NYC Council – LegistarCity law now forces DOT to reveal where bikes and scooters go. Streets and bridges, protected or not. Data goes public. Riders’ movement, danger, and safety projects laid bare. No more hiding the facts.
- 2025-12-10 · Leadership · Streetsblog NYC · ↓ hurts gradeTwo Astoria crowds faced off over the 31st Street bike lane, one side cheering car space, the other lying in the street to mark the dead.
- 2025-12-05 · Leadership · Streetsblog NYC · ↑ helps gradeUnions warn the clock is running. Warehouses boom. Trucks swarm. Amazon shrugs. Advocates push Intro 1396 to a vote to rein in chaos on streets built for people, not endless vans.
- 2025-11-12 · Sponsor · NYC Council – Legistar · ↑ helps gradeGreater CCRB access to body‑camera footage can improve accountability and reduce biased or harmful traffic enforcement against pedestrians and cyclists, supporting equity and willingness to walk/bike. Effects on crash prevention and driver behavior are indirect and likely modest.
- 2025-10-29 · Sponsor · NYC Council – Legistar · ↑ helps gradeStricter limits, supervisor authorization, and a ban on PIT maneuvers reduce the frequency and intensity of high‑speed chases, lowering risk to pedestrians and cyclists. Aerial handoff and disengagement further shift enforcement away from dangerous street pursuits, improving system-wide safety.
- 2025-10-29 · Sponsor · NYC Council – Legistar · ↑ helps gradeStricter limits, supervisor authorization, and a ban on PIT maneuvers reduce the frequency and intensity of high‑speed chases, lowering risk to pedestrians and cyclists. Aerial handoff and disengagement further shift enforcement away from dangerous street pursuits, improving system-wide safety.
- 2025-10-29 · Sponsor · NYC Council – Legistar · ↑ helps gradeBy limiting pursuits to violent felonies, requiring supervisor authorization, capping participating units, prohibiting tactical vehicle intervention, and disengaging when aerial support is available, the bill should reduce high-speed police driving on city streets. Fewer pursuits lower crash risk and collateral injuries to pedestrians and cyclists.
- 2025-09-10 · Sponsor · NYC Council – Legistar · ↑ helps gradeInt. 1375 orders DOT to install 5,000 bike parking stations over five years. 1,000 a year. 400 on commercial blocks. It cuts sidewalk clutter, houses bikes off the curb, and strengthens safety for riders and pedestrians.
- 2025-09-10 · Sponsor · NYC Council – Legistar · ↑ helps gradeInt. 1375 orders DOT to install 5,000 bicycle parking stations over five years, with at least 400 per year on commercial blocks. The measure aims to make cycling more secure, cut sidewalk bike clutter, and boost safety in underserved neighborhoods.
- 2026-10-04 · Leadership · BKReader · ↑ helps gradeALIGN mapped 14,210 street-safety citations tied to Amazon-linked vans. Bus lanes, curbs, intersections, school zones, bike and pedestrian space got blocked. The danger spanned all 51 Council districts.
- 2026-09-30 · Leadership · Streetsblog NYC · ↑ helps gradeAmazon-linked vans piled up 14,290 NYC tickets. School-zone speed. Blocked bus lanes. Choked bike lanes. The Delivery Protection Act targets the system that keeps drivers moving and streets dangerous.
- 2026-09-14 · Leadership · Streetsblog NYC · ↓ hurts gradeAmazon praised e-quads. Now it warns it may scrap them if Intro 518 passes. That threat could push more delivery trips into vans, raising curbside chaos and danger for people walking and biking.
- 2026-08-16 · Leadership · BKReader · ↑ helps gradeMayor Zohran Mamdani backed the Delivery Protection Act. It targets last‑mile warehouses blamed for rising crashes and worker injuries. It would force licenses, training, and accountability on delivery giants.
- 2026-10-04 · Leadership · BKReader · ↑ helps gradeALIGN mapped 14,210 street-safety citations tied to Amazon-linked vans. Bus lanes, curbs, intersections, school zones, bike and pedestrian space got blocked. The danger spanned all 51 Council districts.
- 2026-09-30 · Leadership · Streetsblog NYC · ↑ helps gradeAmazon-linked vans piled up 14,290 NYC tickets. School-zone speed. Blocked bus lanes. Choked bike lanes. The Delivery Protection Act targets the system that keeps drivers moving and streets dangerous.
- 2026-09-14 · Leadership · Streetsblog NYC · ↓ hurts gradeAmazon praised e-quads. Now it warns it may scrap them if Intro 518 passes. That threat could push more delivery trips into vans, raising curbside chaos and danger for people walking and biking.
- 2026-08-16 · Leadership · BKReader · ↑ helps gradeMayor Zohran Mamdani backed the Delivery Protection Act. It targets last‑mile warehouses blamed for rising crashes and worker injuries. It would force licenses, training, and accountability on delivery giants.
30-83 31st Street, Astoria, NY 11102
718-274-4500
250 Broadway, Suite 1778, New York, NY 10007
212-788-6969
Police Precinct NYPD 114th Precinct —
Other Geographies See nearby areas
▸ Other Geographies
AD 34 Assembly District 34 sits in Queens, District 22, Precinct 114.
It contains Queens CB 1, Queens CB 3, Astoria (North)-Ditmars-Steinway, Astoria (East)-Woodside (North), St. Michael's Cemetery, Jackson Heights.