CrashCount NYC
See the crashes on your streets. Build the case for safer ones.
CrashCount helps neighbors advocate for safer streets using police crash records, political records, local reporting, and open geographic data.
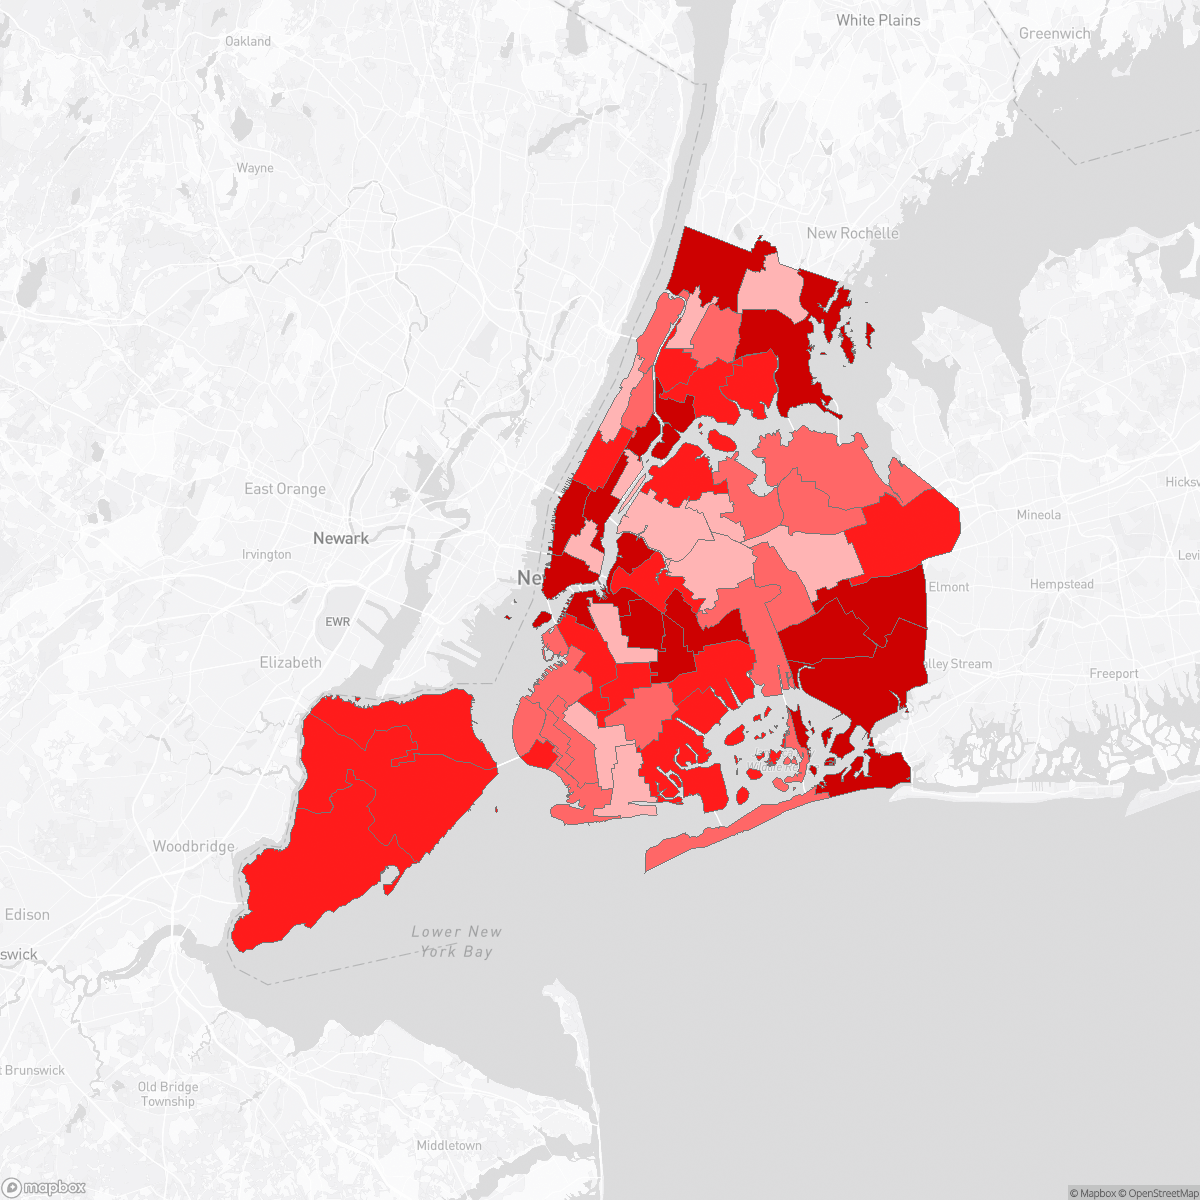
We provide individual dashboards for 525 regions, including all boroughs, city council districts, state assembly districts, state senate districts, police precincts, community boards, and neighborhoods.
Crash Finder
Try Crash Finder
Look up any street, school, address, or intersection to see how safe the streets are.
Built from public evidence - updated nightly
CrashCount uses vetted public datasets and reporting feeds, refreshed nightly.
NYC Crash Count
Jan 1, 2026 - Jun 1, 2026- Crashes 34,170
- Injuries 19,192
- Serious injuries 1,113
- Deaths 90
Driver hit motorcyclist on FDR Drive


Safety alerts
Queensboro Bridge death as NYC sees 4 killed in 7 days
May 21 to May 28 saw 68 crashes in New York City. Four people died. Seventy eight had serious injuries. This citywide alert has fired 12 times in 90 days.
Brooklyn hit hard in one week
Brooklyn saw 28 crashes in 7 days with 2 deaths and 30 serious injuries.
Council District 23: 21 crashes in 7 days, with 1 death
May 24 to May 31 saw 21 crashes in Council District 23. One person was killed. Five people had serious injuries.
Queens CB 8 saw 20 crashes in 7 days and one death
From May 19 to May 26, Queens CB 8 had 20 crashes. One person died. Six had serious injuries.
Precinct 107 spikes with 20 crashes in one week
May 19 to May 26 saw 20 crashes in Precinct 107. One person was killed. Six had serious injuries and five more were hurt.
Assembly District 46 hit hard in one week
May 21 to May 28 saw 17 crashes in Assembly District 46. One person died. Three people had serious injuries.
Recent coverage and public statements
Public statement
Mamdani Backs Safety‑Boosting Ashland Place Protected Bike Lanes
DOT unveiled a redesign to end “Crashland.” A two-way protected lane and a shared street would remake Ashland Place and Hanson Place after a crash-plagued gap hurt cyclists and pedestrians.
Press coverage
Guilty verdict in Deer Park salon crash
Jurors convicted Steven Schwally of murder after he crashed into a Deer Park nail salon. Four people died and nine were hurt. Prosecutors said he was drunk and speeding.
Public statement
Mamdani Backs Safety‑Boosting W. 72nd Protected Bike Lane
CB7 voted 26-19 to back a W. 72nd redesign. It would trade car lanes for a two-way protected bike lane and bus islands. The vote is advisory. DOT could build it as early as summer.
Public statement
Mamdani Champions Fare‑Free Buses Over Targeted Fair Fares
IBO says expanding Fair Fares costs less than fare-free buses. The help is narrower. The tradeoff is who gets on and who is left paying.
Turn local evidence into action
When people can see what is happening nearby, they become a force for safer streets. Use this data to push for lower speeds and stronger repeat-offender enforcement.
How safe are your streets?
We have dashboards for every region in NYC.
Safety alerts
Queensboro Bridge death as NYC sees 4 killed in 7 days
May 21 to May 28 saw 68 crashes in New York City. Four people died. Seventy eight had serious injuries. This citywide alert has fired 12 times in 90 days.
Brooklyn hit hard in one week
Brooklyn saw 28 crashes in 7 days with 2 deaths and 30 serious injuries.
Council District 23: 21 crashes in 7 days, with 1 death
May 24 to May 31 saw 21 crashes in Council District 23. One person was killed. Five people had serious injuries.
Queens CB 8 saw 20 crashes in 7 days and one death
From May 19 to May 26, Queens CB 8 had 20 crashes. One person died. Six had serious injuries.
Precinct 107 spikes with 20 crashes in one week
May 19 to May 26 saw 20 crashes in Precinct 107. One person was killed. Six had serious injuries and five more were hurt.
Assembly District 46 hit hard in one week
May 21 to May 28 saw 17 crashes in Assembly District 46. One person died. Three people had serious injuries.